What is Pandas Profiling in Python?
Learn via video courses
Pandas profiling is used to generate profile reports from a Pandas DataFrame. Even though a method called pandas.describe() exists that gives us a brief idea about the dataframe, why do we need another such method? The answer to the question is while we are performing EDA (Exploratory Data Analysis) such a brief piece of information is not enough. A detailed report about the dataframe such as its missing values, correlations, histograms, etc. is required. Thus pandas profiling gives the user these details about the pandas DataFrame with df.profile_report(), which automatically generates a standardized univariate and multivariate report for a deeper understanding of data. It generates an HTML report.
Syntax
pandas_profiling.ProfileReport(df, **kwargs)
Parameters:
- df(DataFrame): It takes in dataframe as the parameter value i.e. includes data to be analyzed. The dataframe can be the whole dataset or a part of it or any created object.
- bins: It takes in integer values. It lists the number of bins in the histogram. The default value is set to 10.
- check_correlation: It takes in boolean values. If the parameter is set to False it will not check correlation, for True it will perform correlation. The default value is set to True.
- correlation_threshold: It takes in float values. It defines the threshold value to determine if the variable pair is correlated. The default value is set to 0.9.
- correlation_overrides: It takes in list datatype as the parameter value. The variable names are not supposed to be rejected just because they are correlated. There is no variable in the list (None) by default.
- check_recoded: It accepts a boolean value. According to the parameter value, it will check whether or not to check recoded correlation. It is a very memory-consuming operation in terms of computation thus it shall be performed only for small datasets. Its default value is set to False.
Note: check_correlation must be true to disable this check.
- pool_size: It accepts integer values. It represents the number of workers in a thread pool. The default value is equal to the number of CPUs.
Installation
There are various ways to install the package. We will look into all the ways one by one.
-
Using pip:
pip install -U pandas-profiling
If you are trying to run it locally on your device, or running a Kaggle, Google Colab Notebook the command to be written is:
import sys
!{sys.executable} -m pip install -U pandas-profiling[notebook]
!jupyter nbextension enable --py widgetsnbextension
Note: After you perform the steps reload/restart the kernel.
-
Using conda:
A new conda environment containing the pandas profiling module can be created using the below-mentioned commands:
conda env create -n pandas-profiling
conda activate pandas-profiling
conda install -c conda-forge pandas-profiling
-
Frome source:
pip install https://github.com/ydataai/pandas-profiling/archive/master.zip
After downloading we can run it on the terminal.
-
Jupyter Notebook/Lab
To run it in the jupyter notebook we need the widgets extension. The widget extension is used for progress bars and the interactive widget-based report to work. To activate the extension we can either do it:
Using pip:
pip install pandas-profiling[notebook] jupyter nbextension enable --py widgetsnbextension
Or via conda:
conda install -c conda-forge ipywidgets
Dataset and Setup
Code Example 1:
Output:
Code Example 2:
Output:
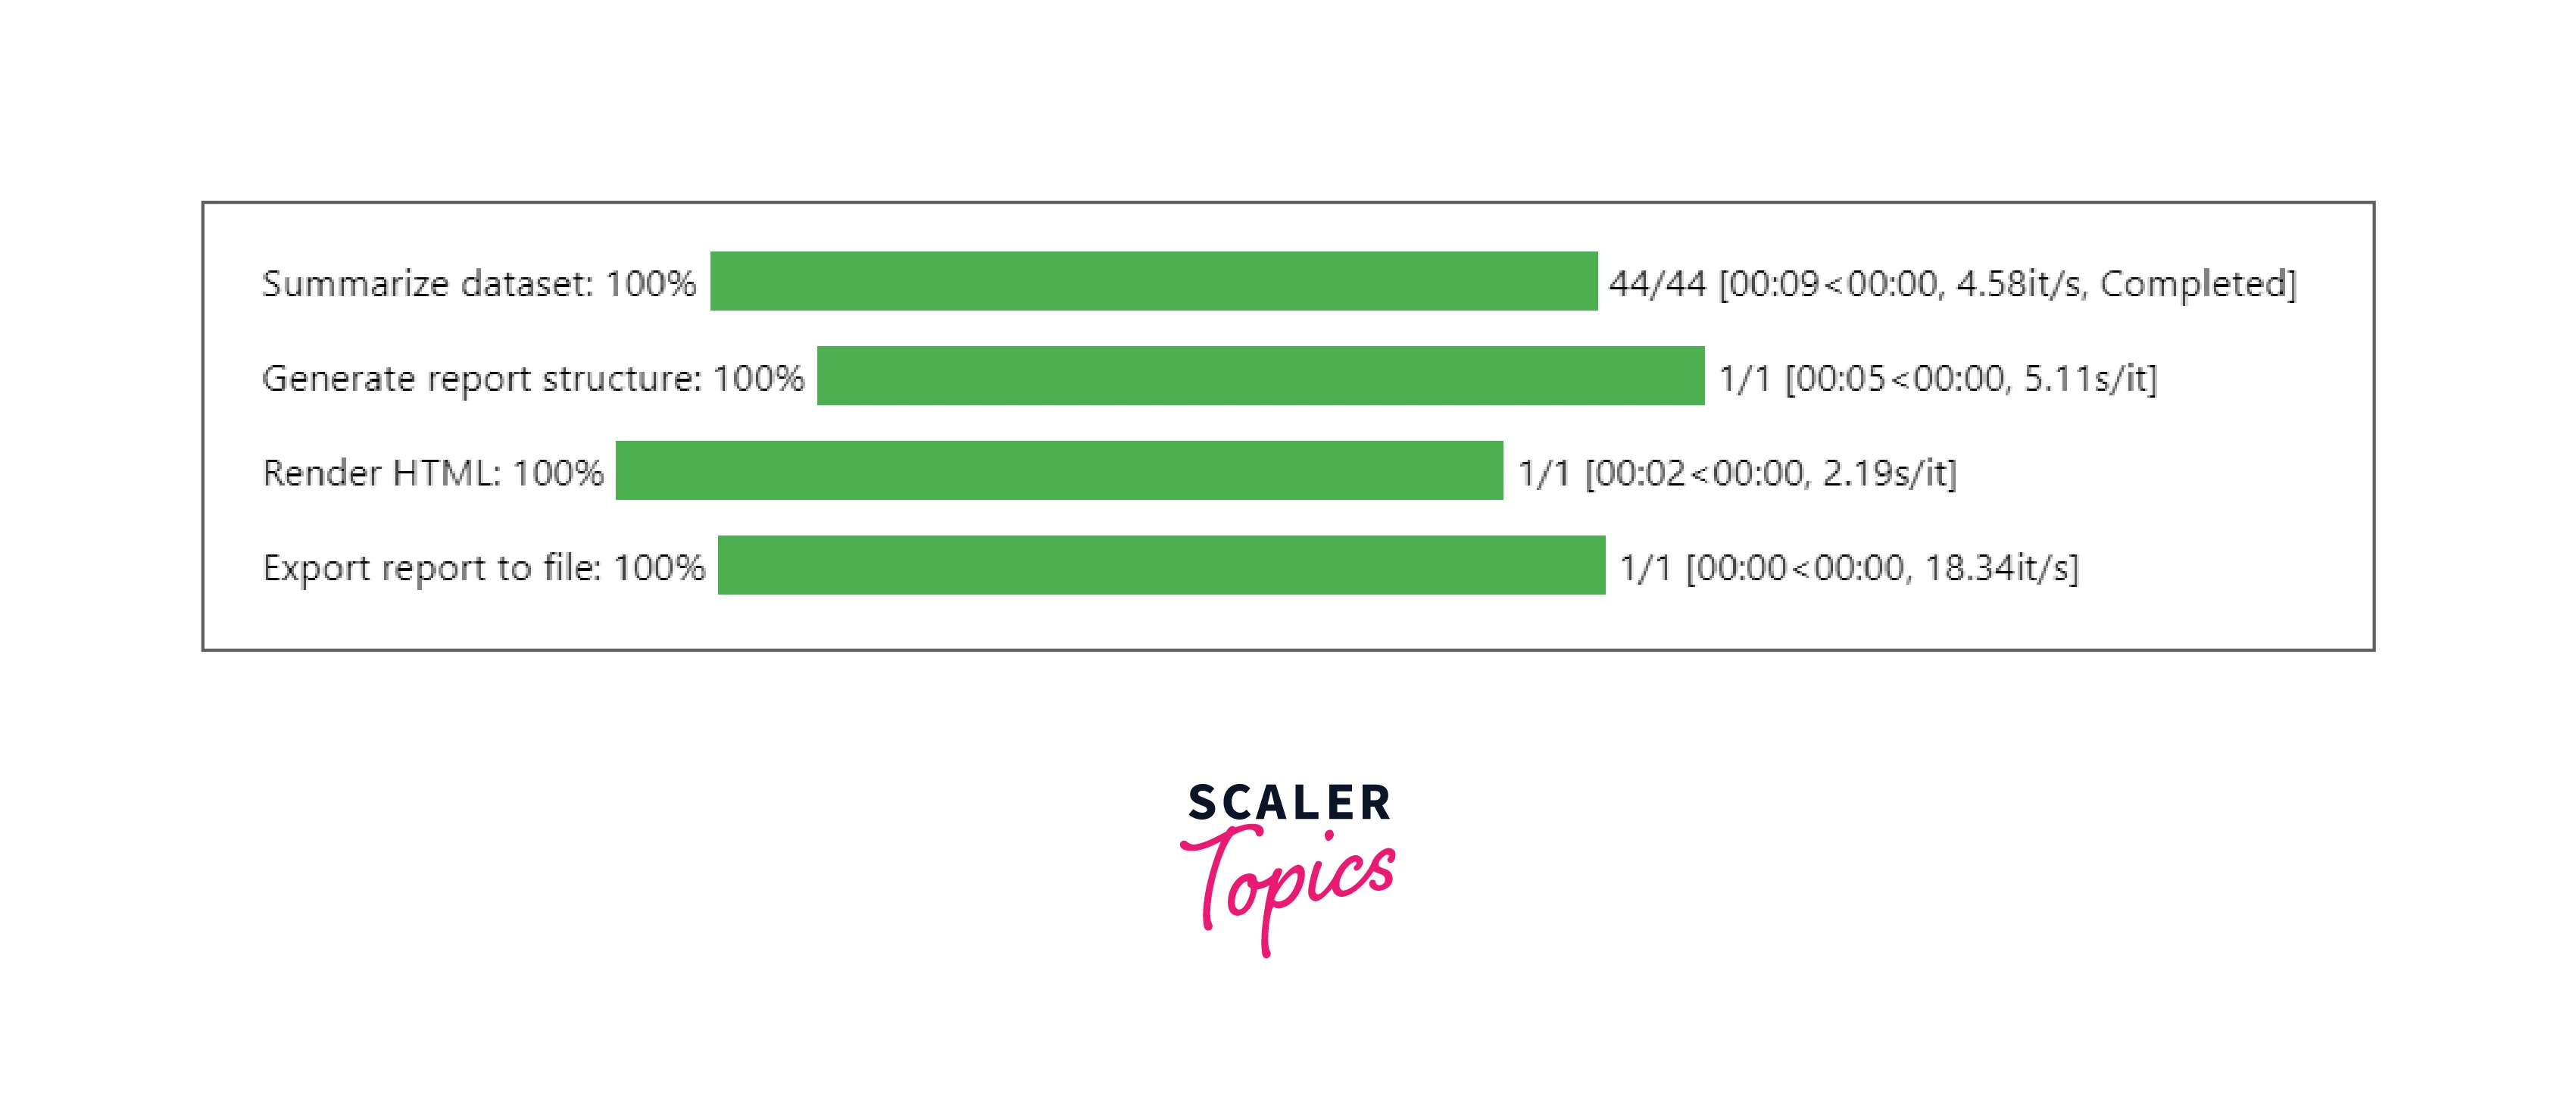
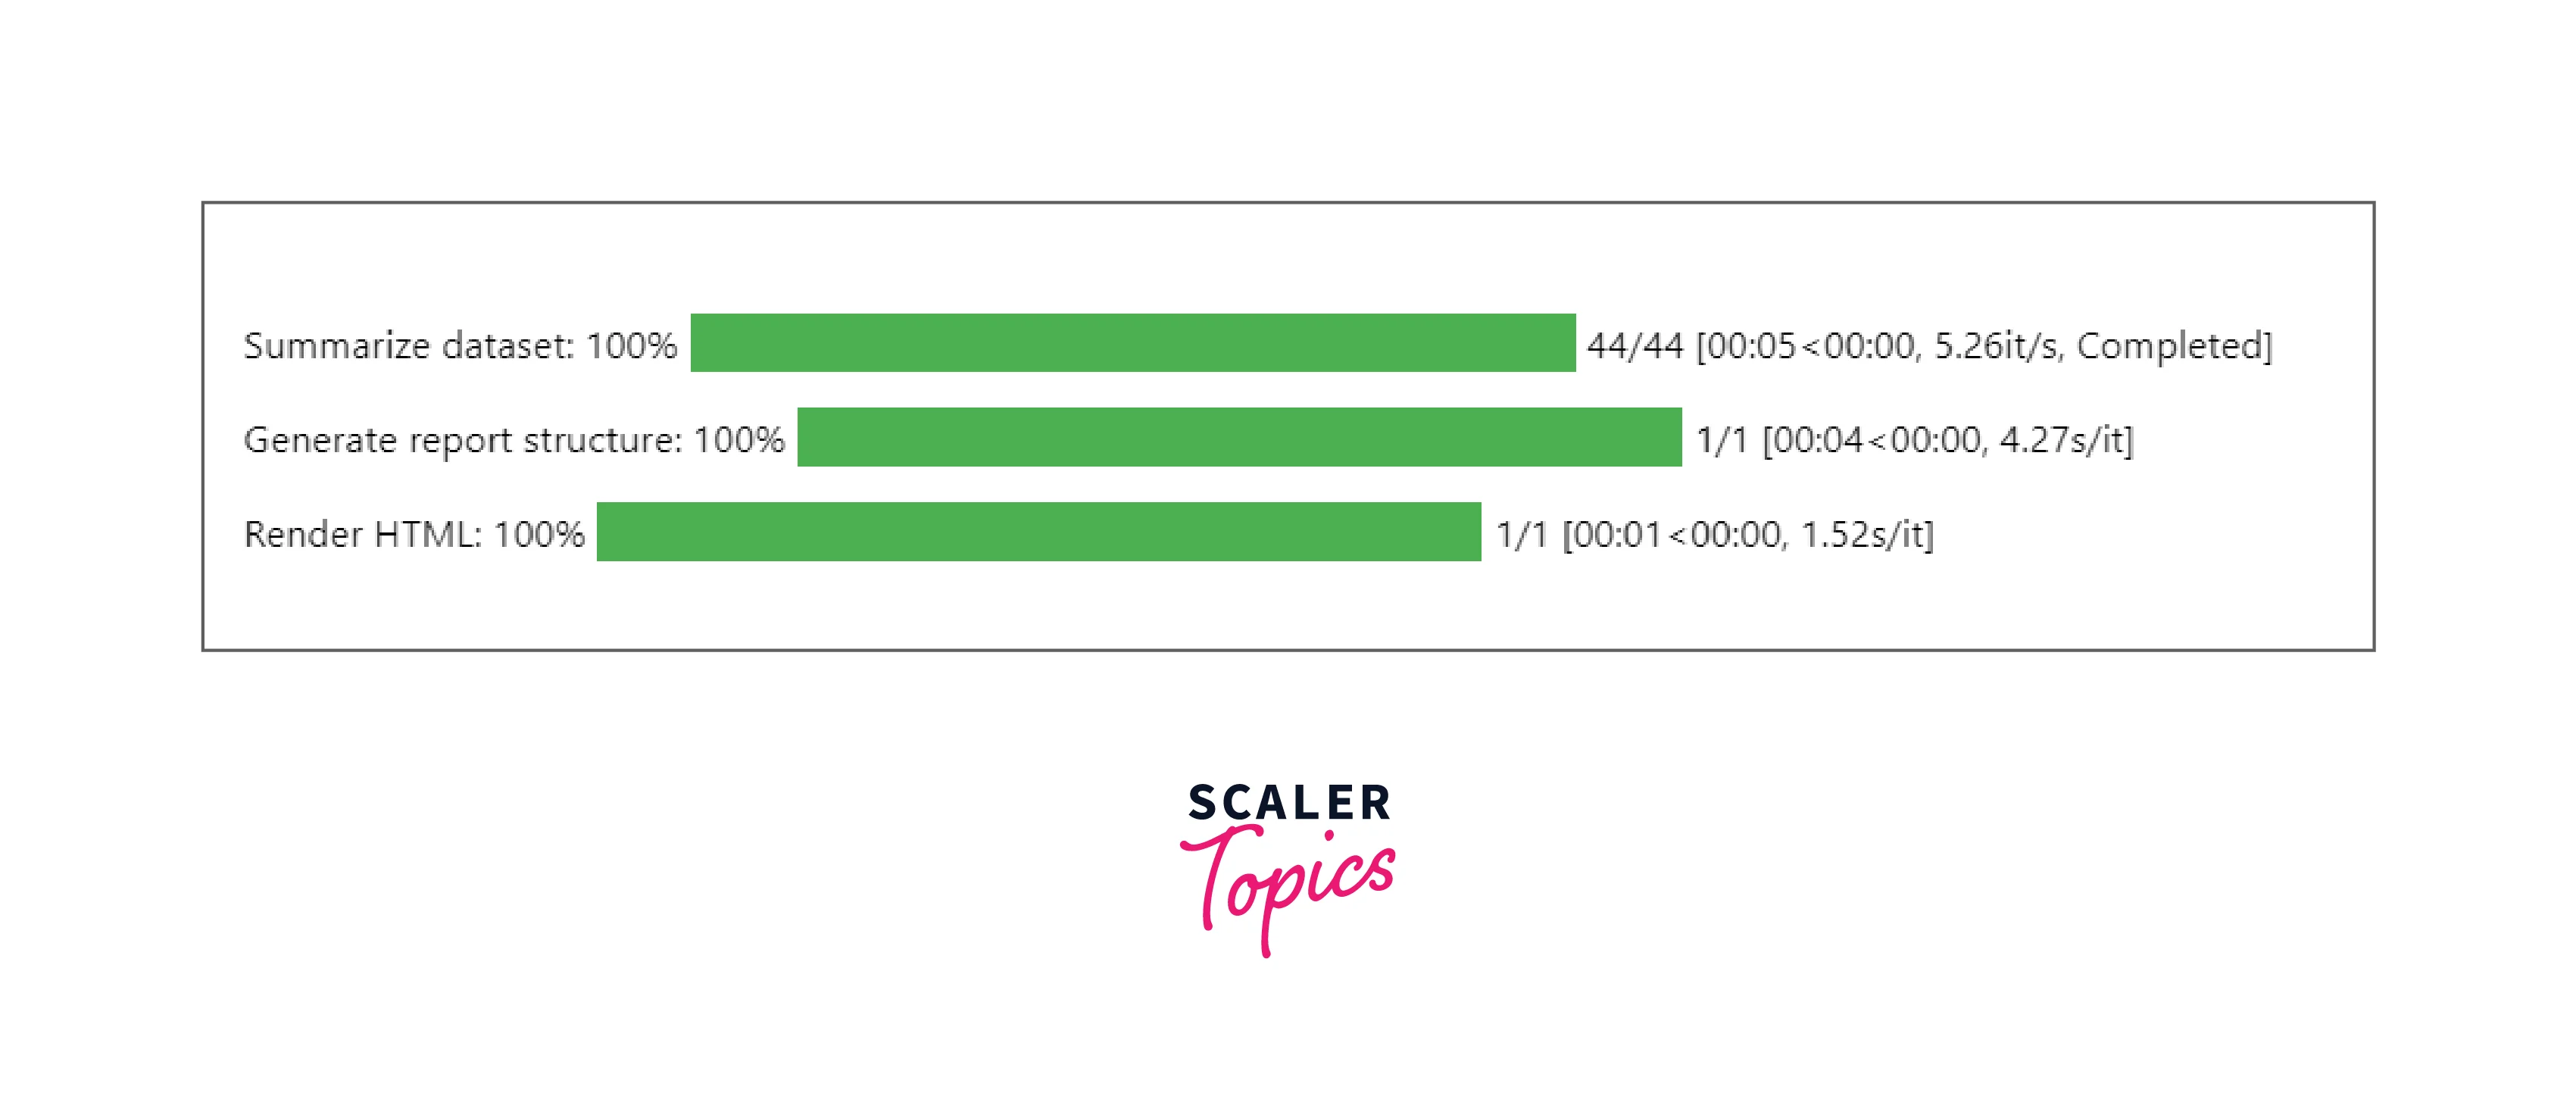
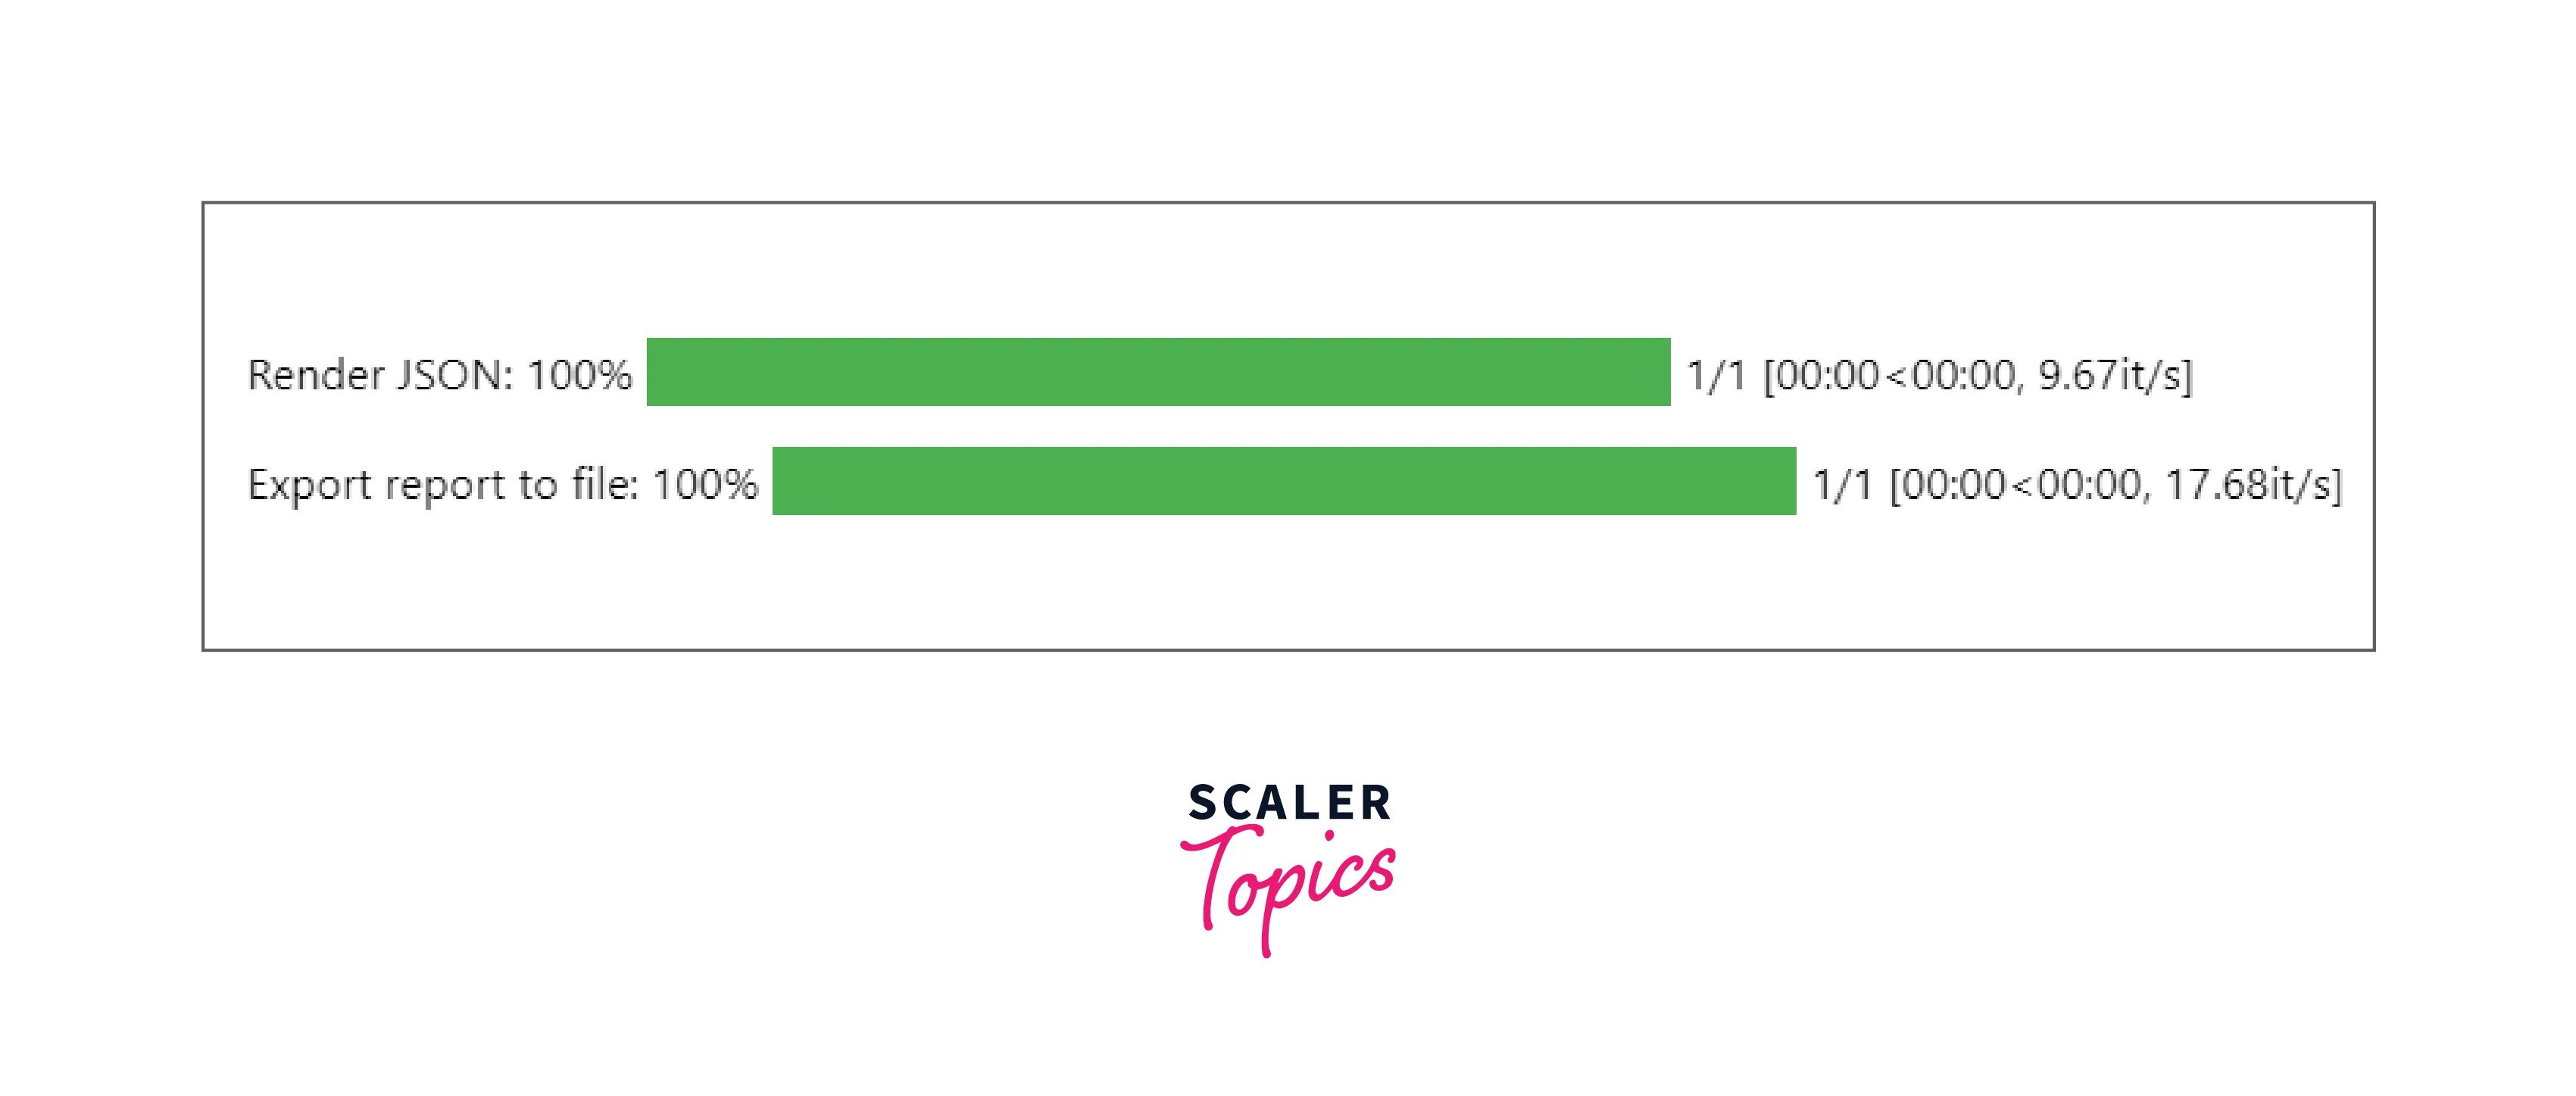
Pandas Profiling Report
The Pandas profiling report generated is concerning each column in an HTML format. The details included in the report are:
-
Type Inference: It analyzes the data types of columns in a DataFrame.
-
Essentials: It lists the type, unique values, and indication of missing values.
-
Quantile Statistics: It includes minimum value, Q1, median, Q3, maximum value, 5-th percentile, 95th percentile, range, and interquartile range.
-
Descriptive Statistics: It includes Standard deviation, Coefficient of variation(CV), Kurtosis, Mean, Median Absolute Deviation (MAD), Skewness, Sum, Variance, and Monotonicity.
-
It also lists the Most frequent and Extreme values(minimum and maximum 10 values).
-
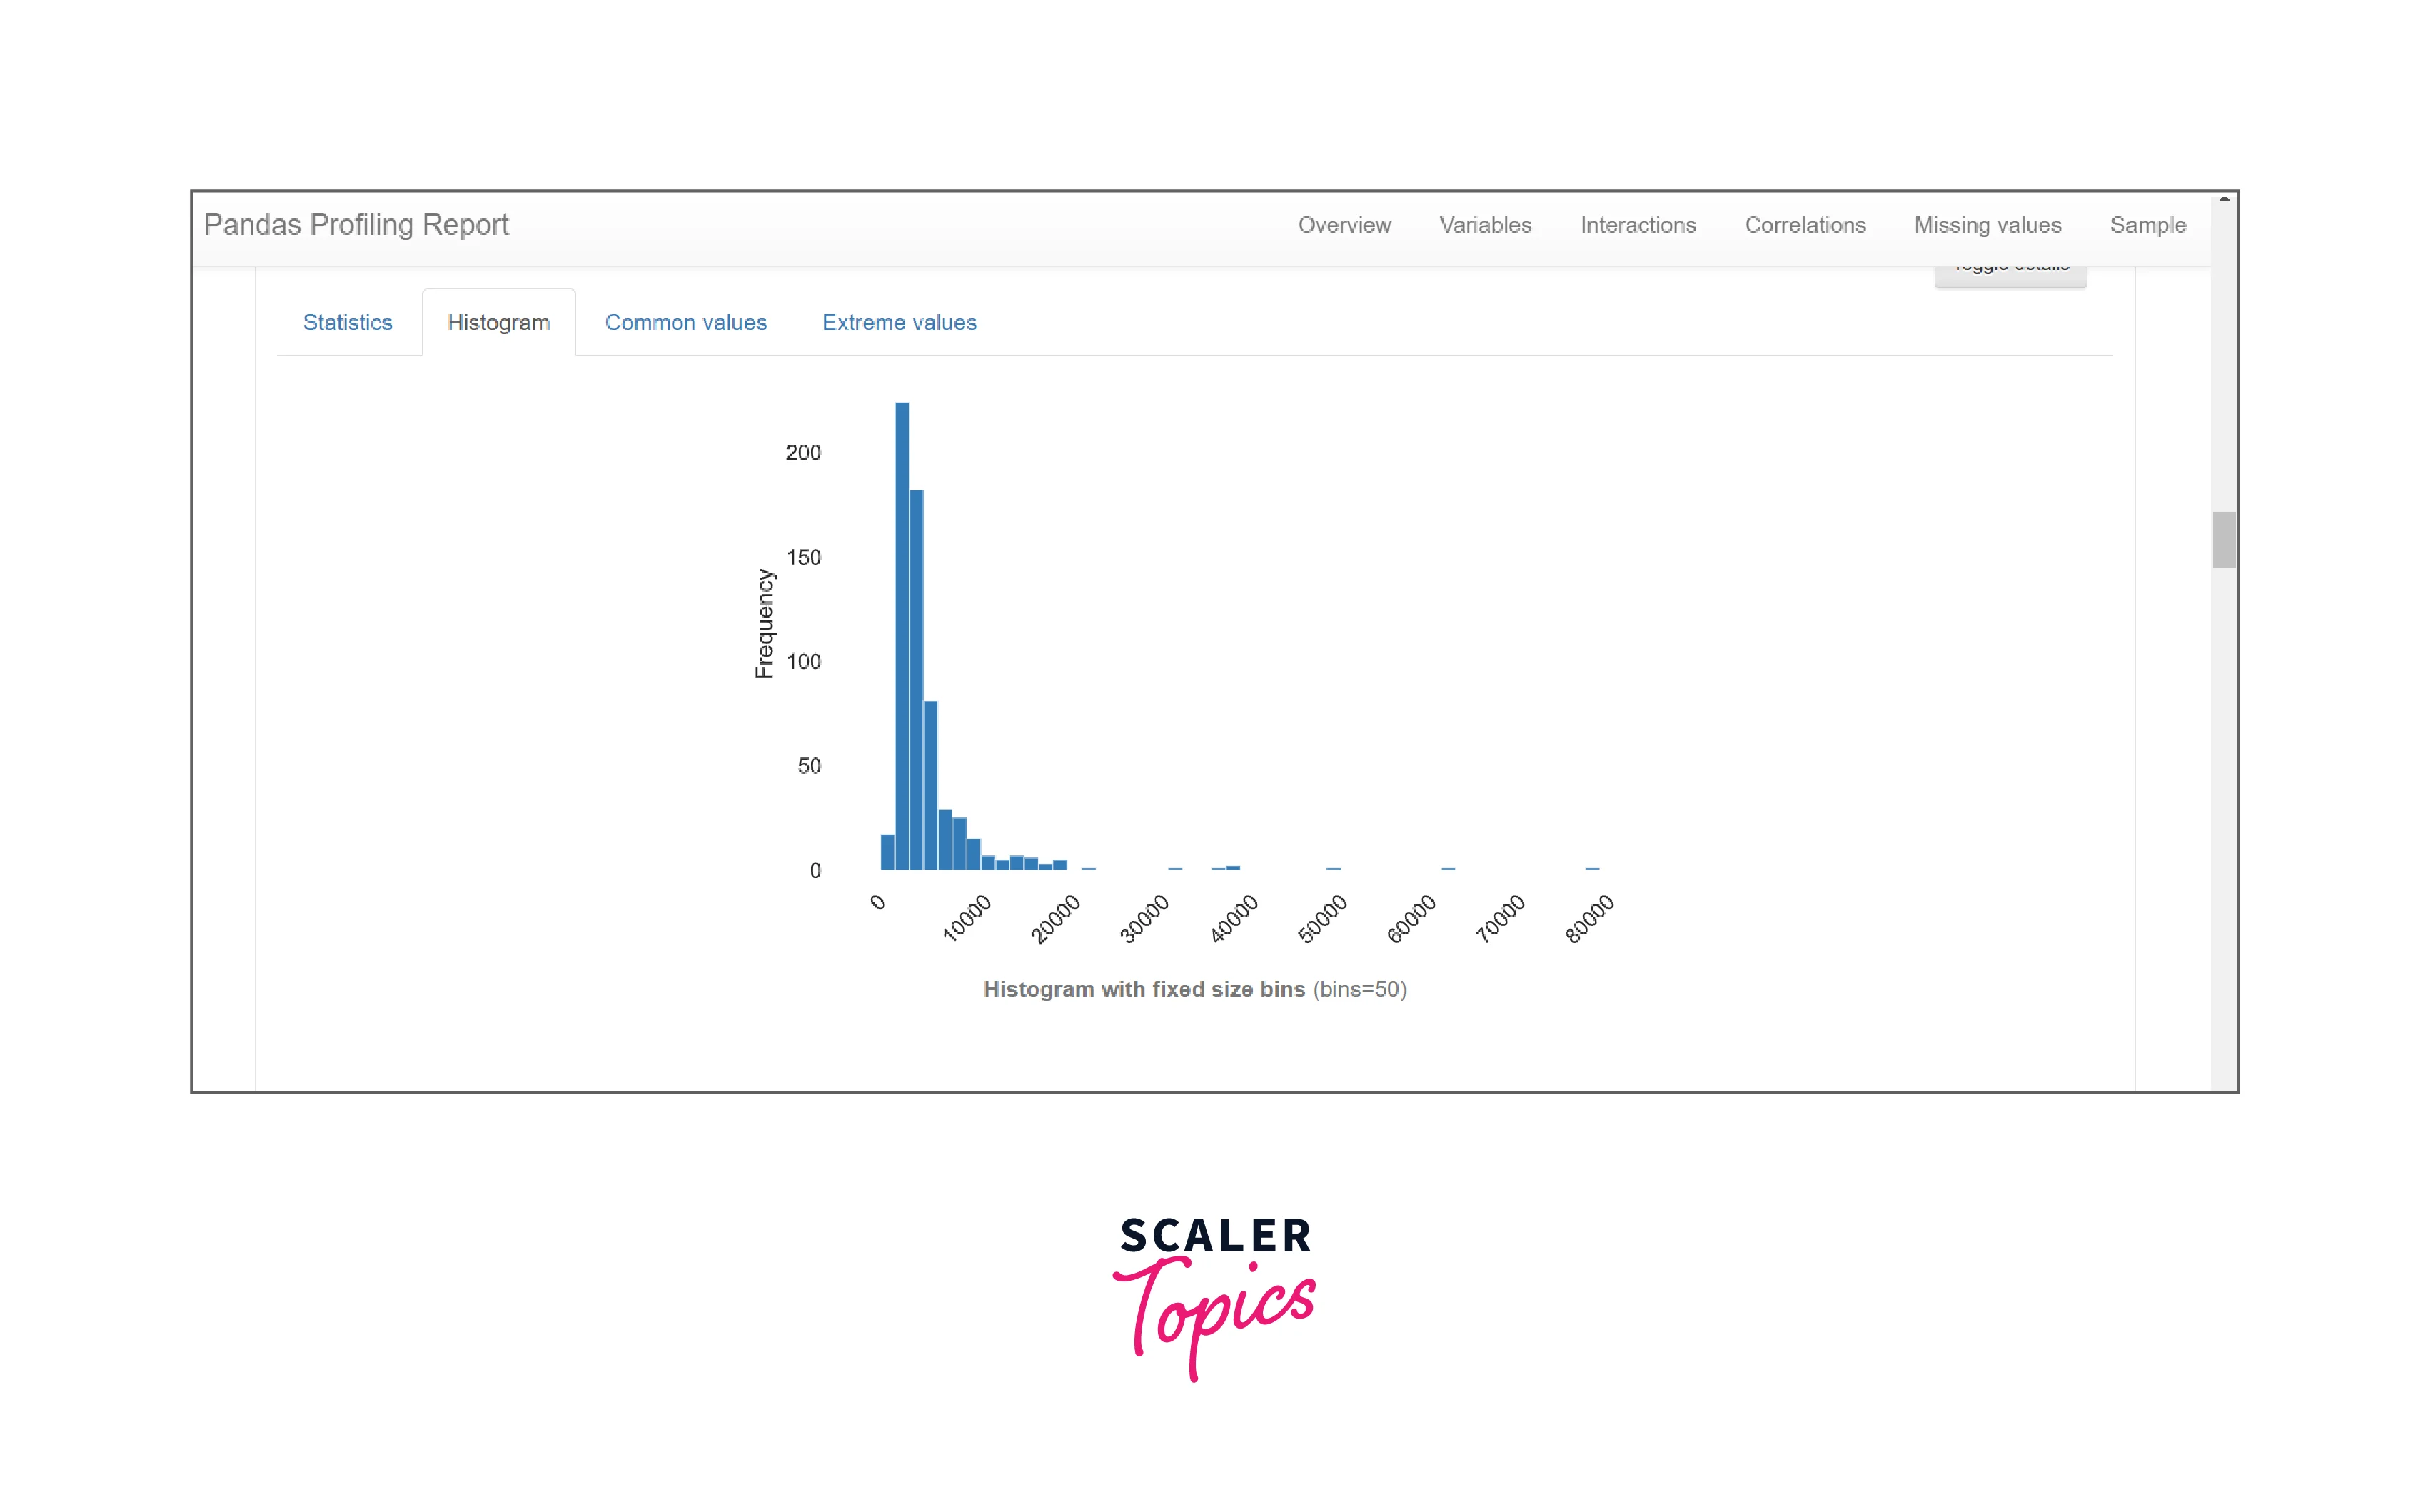
Histograms: In the case of numerical and categorical data types representation of data is done with the help of histogram as well.
-
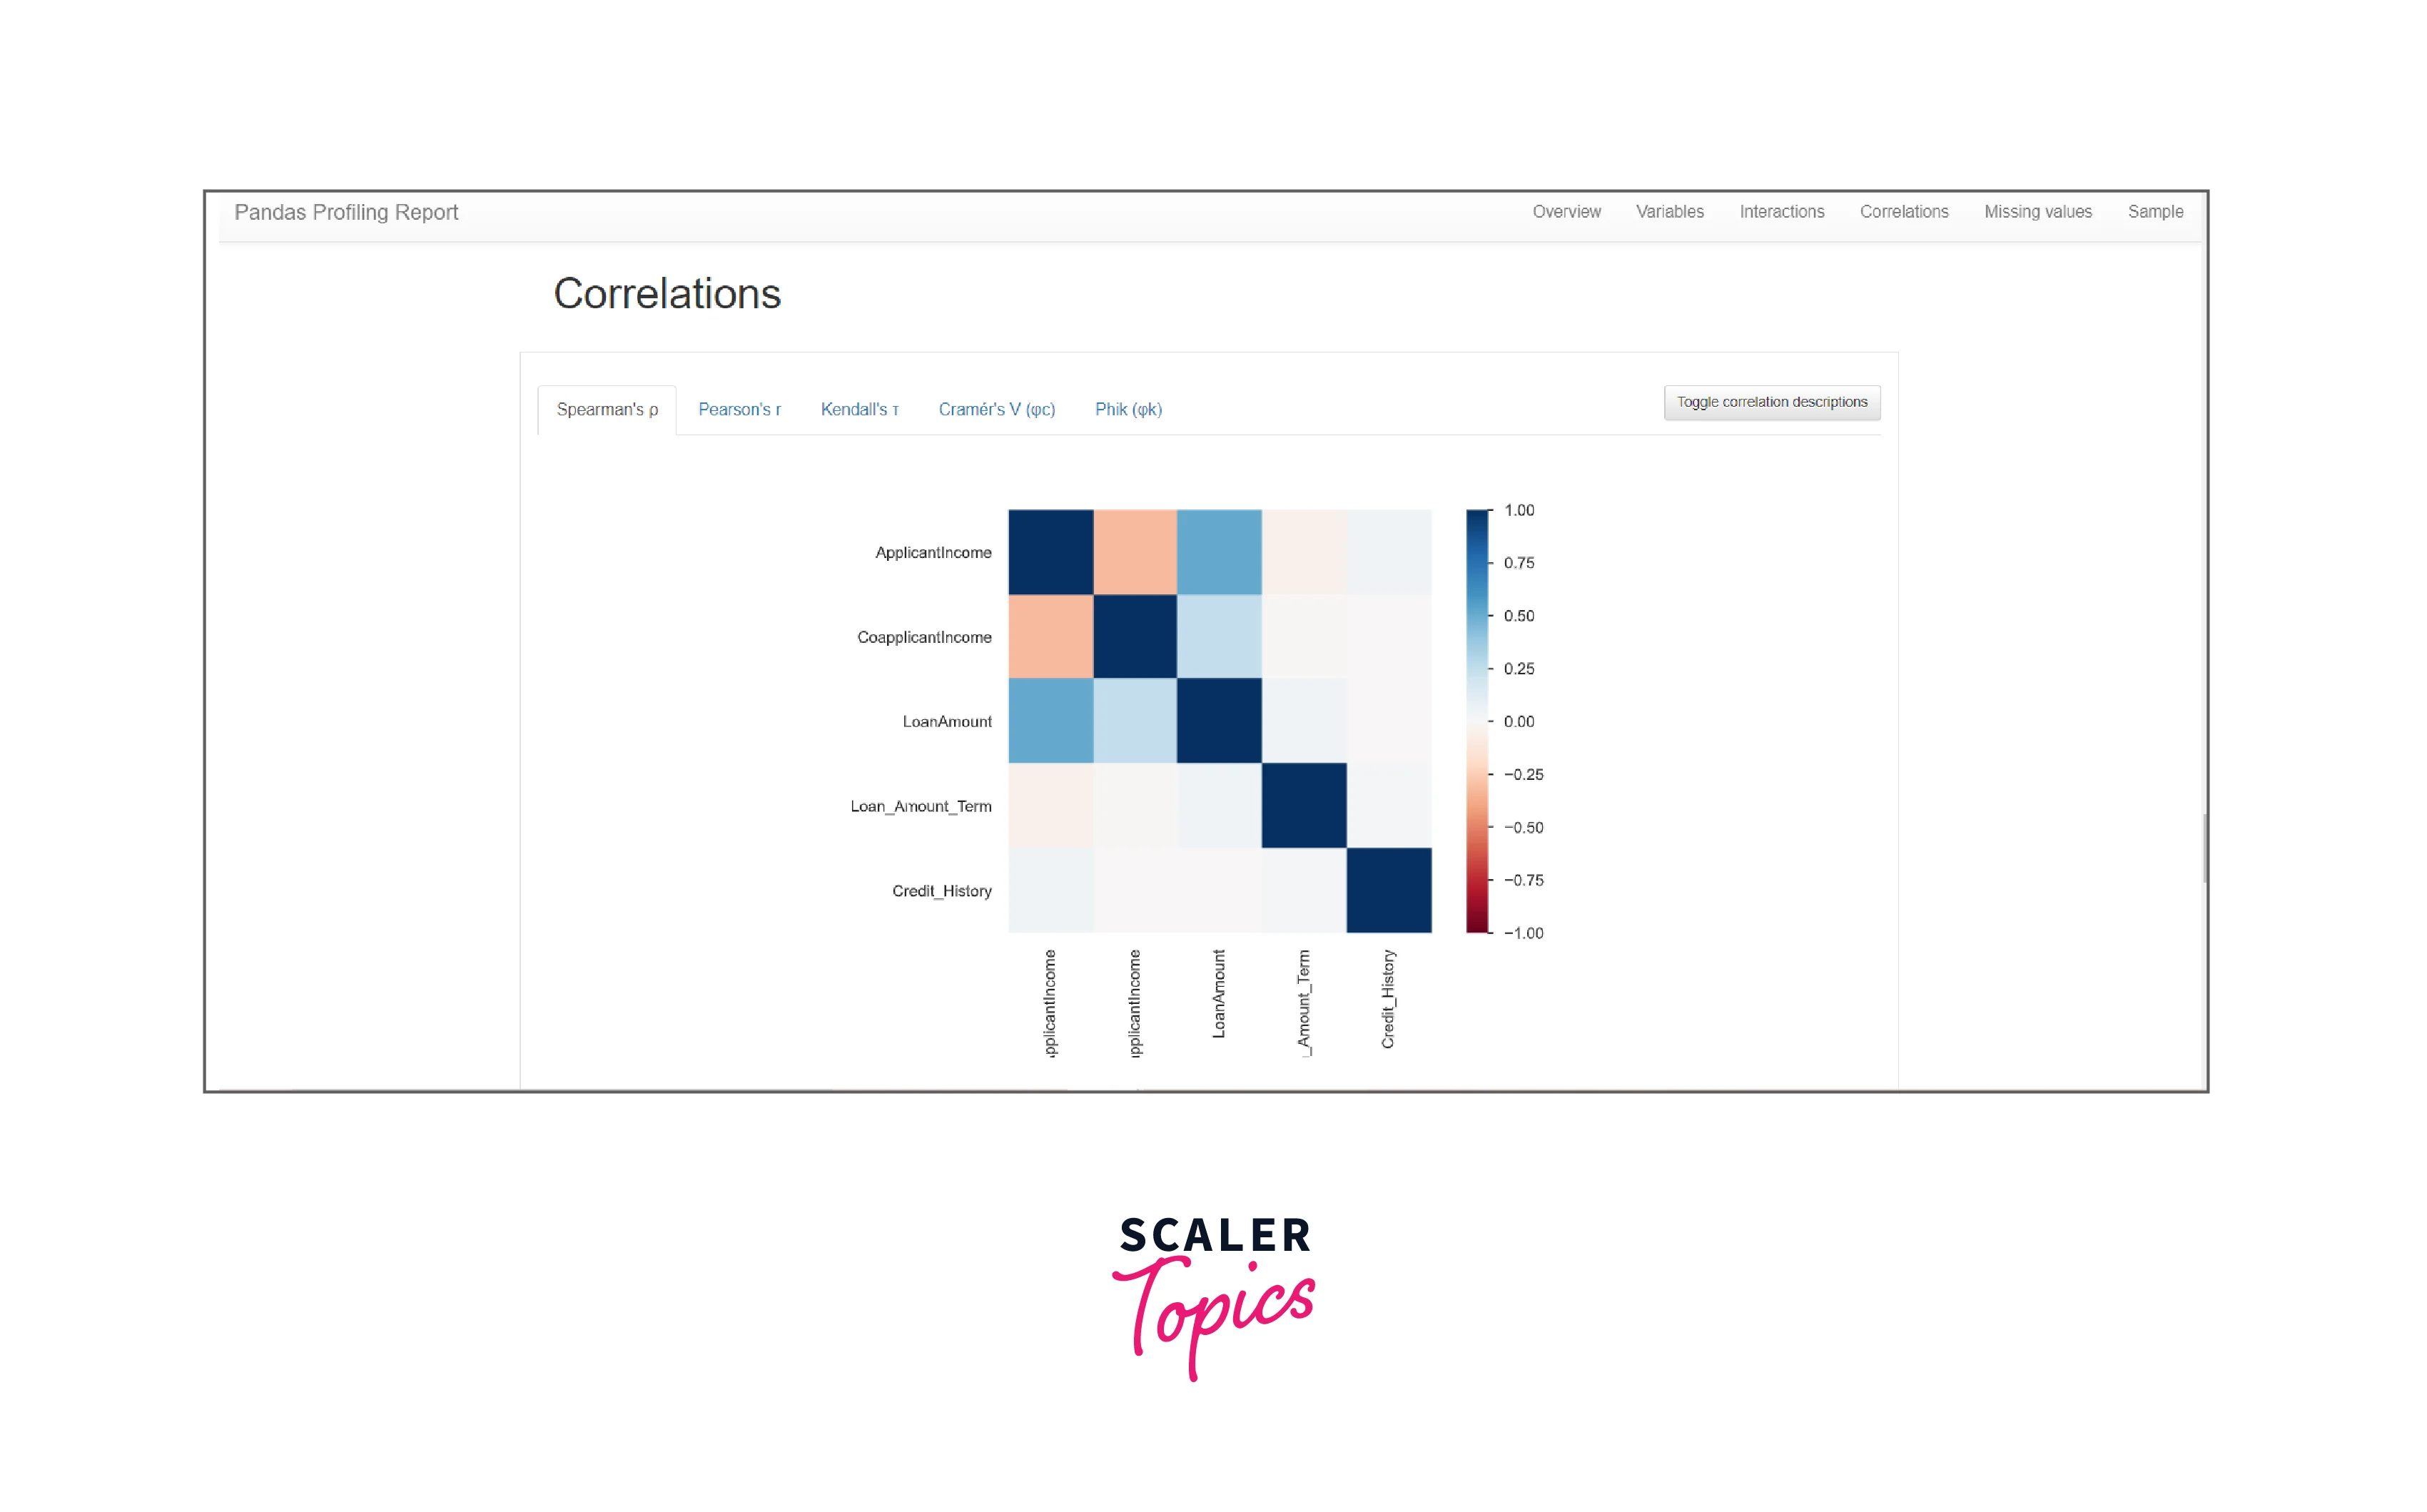
Correlations: It shows high correlation warnings that are based on different correlation metrics (Spearman, Pearson, Kendall, Cramér’s V, Phik, Auto) in the form of a colored square-like graph.
-
Missing Values: The missing values in the dataset are shown in terms of counts, matrix, dendrogram, and heatmap.
-
Duplicate Rows: It contains a list of the most common duplicated rows.
-
Text Analysis: It lists the most common categories like uppercase, lowercase, and separator, in scripts Latin, Cyrillic, and for blocks ASCII, Cyrilic, etc.
The report contains three additional sections for much detailed analysis:
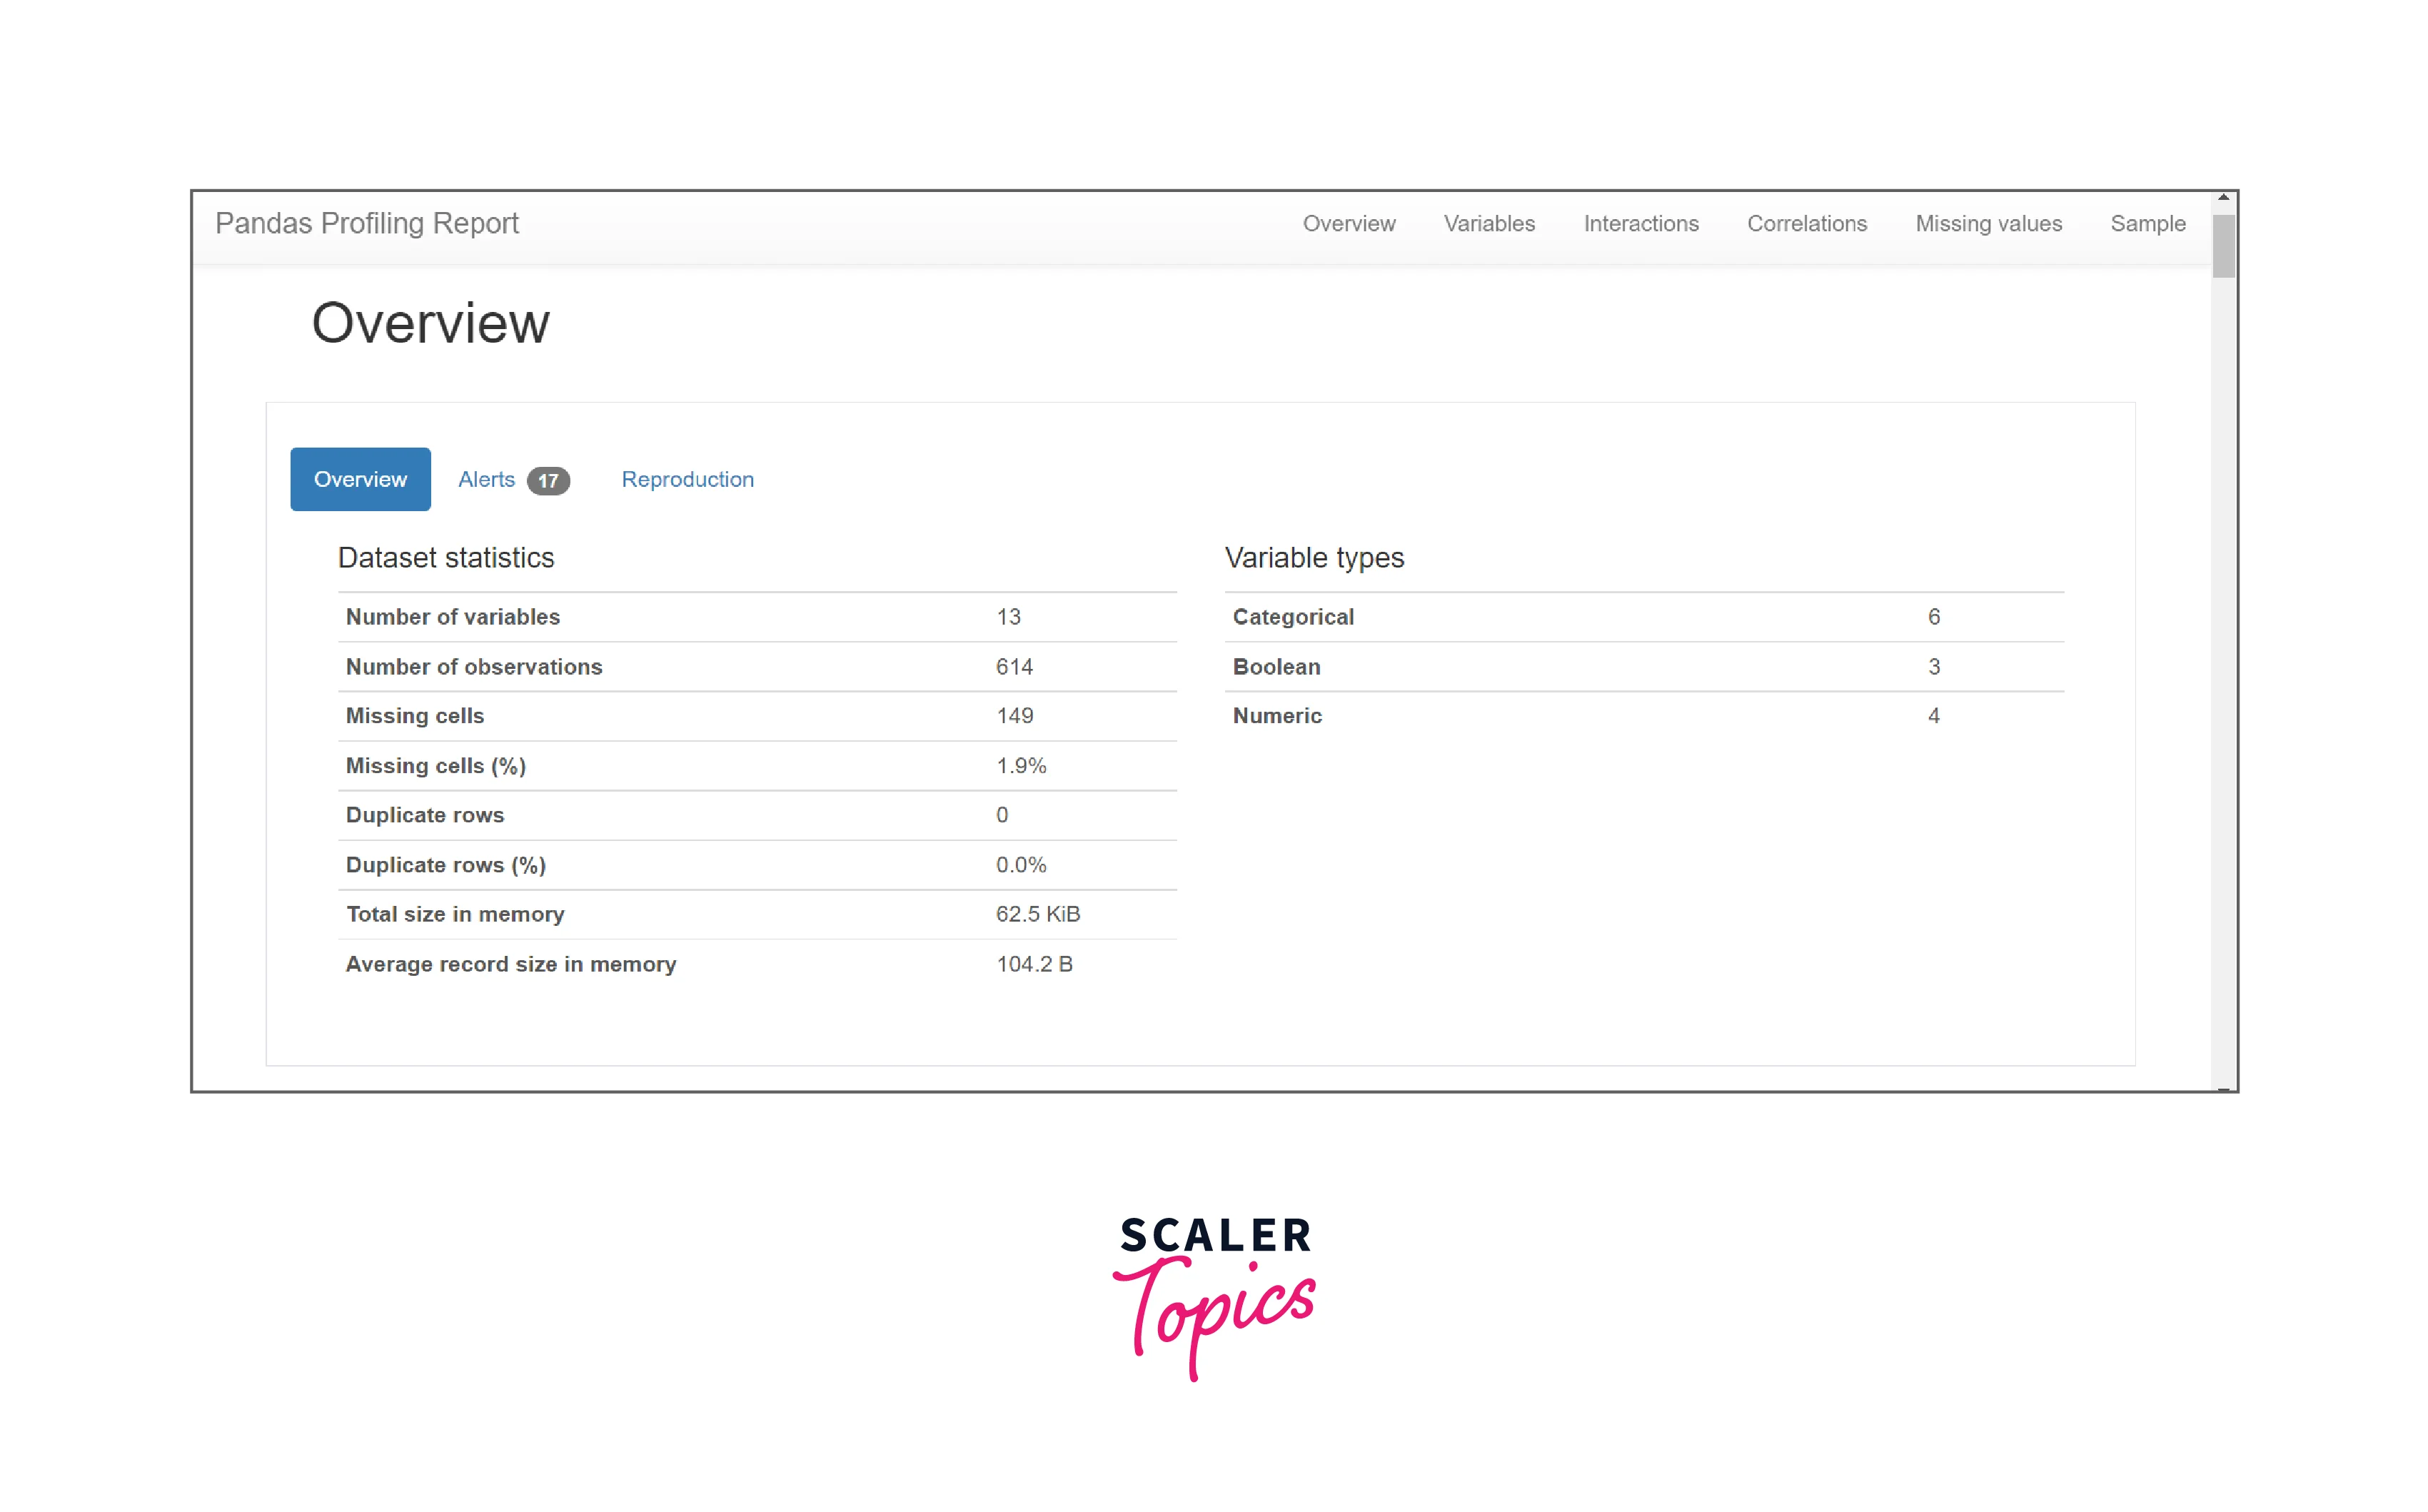
- Overview: This section is the first section in the Pandas profiling Report.
- It shows the summarised statistics for the dataset as a whole.
- It displays the number of variables and the number of observations in the dataframe which is nothing but the number of rows in the dataset.
- It also provides the number of missing cells, the percentage of missing cells, the total number of duplicate rows, and the total percentage of the same.
- Along with these, it includes data around the size of the dataset in memory, the average record size in memory, and all the variable data types present in the dataset.
All of this data is of utmost importance but the one that cannot be neglected is the statistics on missing cells and duplicate rows as these help in the identification of corner test cases and can lead to a discrepancy in observation missing out on important data.
-
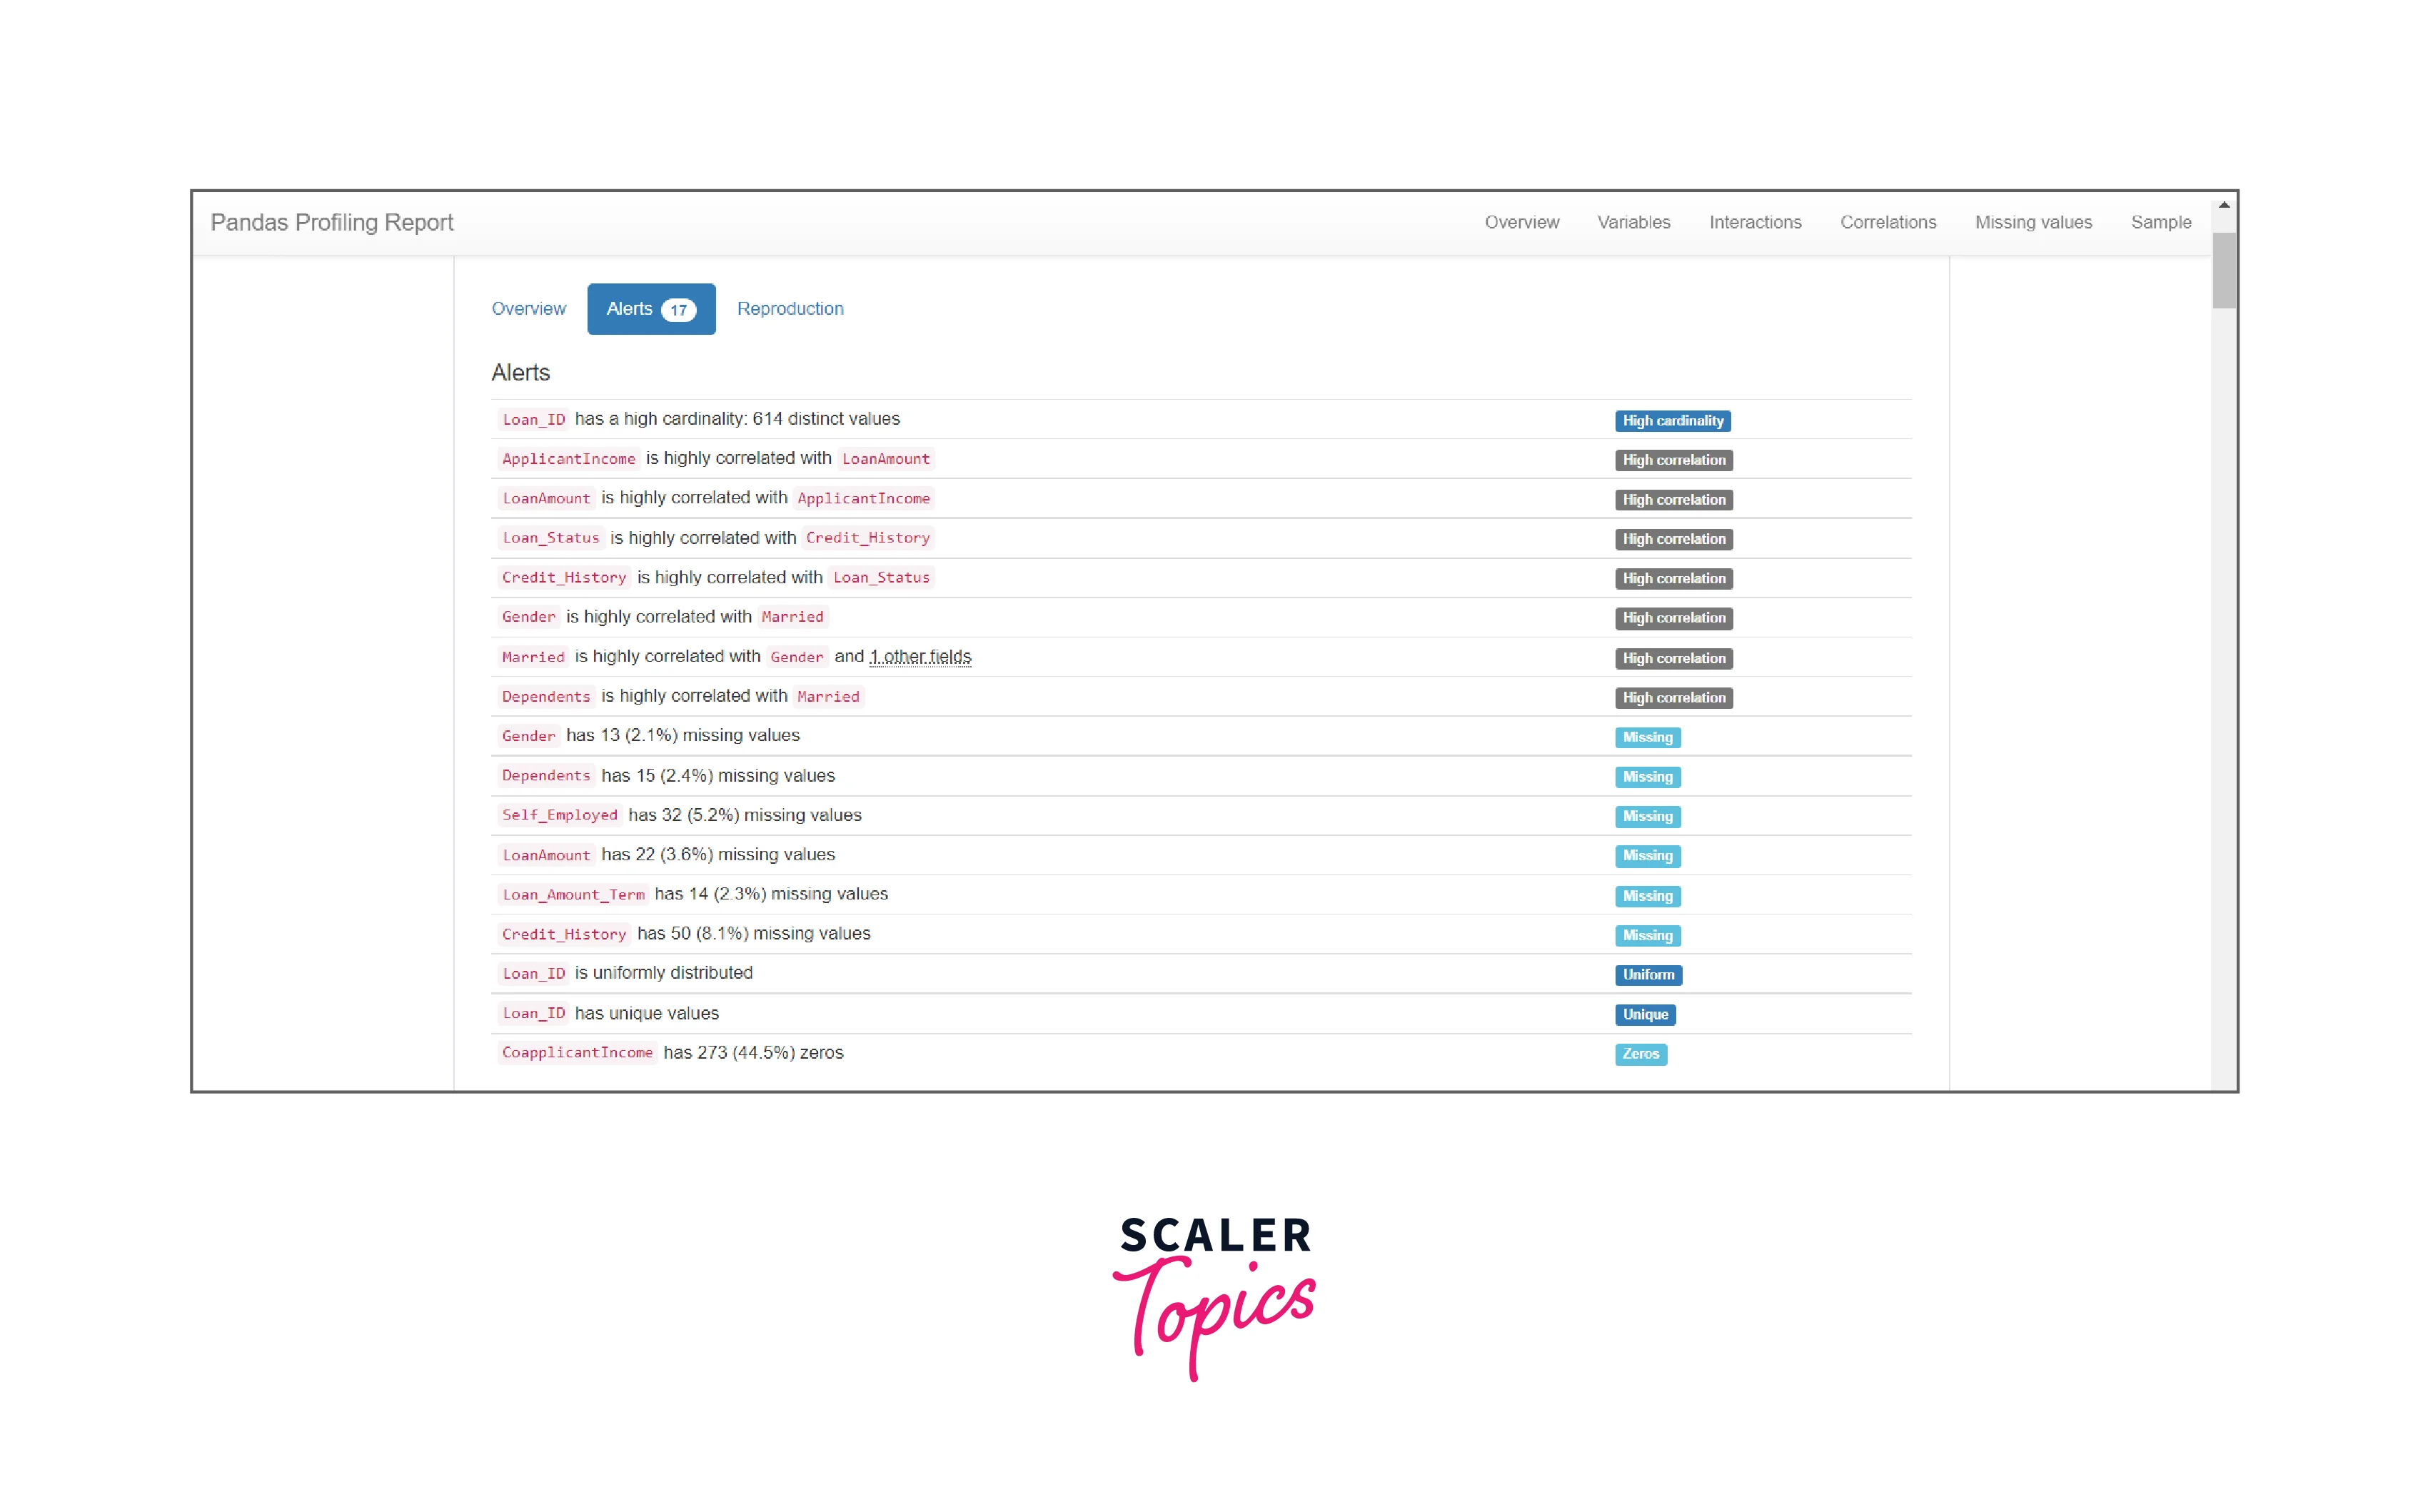
Alerts: Under the alerts tab within the Overview section, we can find collated warnings for any of the variables within the dataset. It is nothing but a comprehensive list of potential data quality issues such as high correlation, high cardinality, skewness, uniformity, zeros, missing values, etc.
-
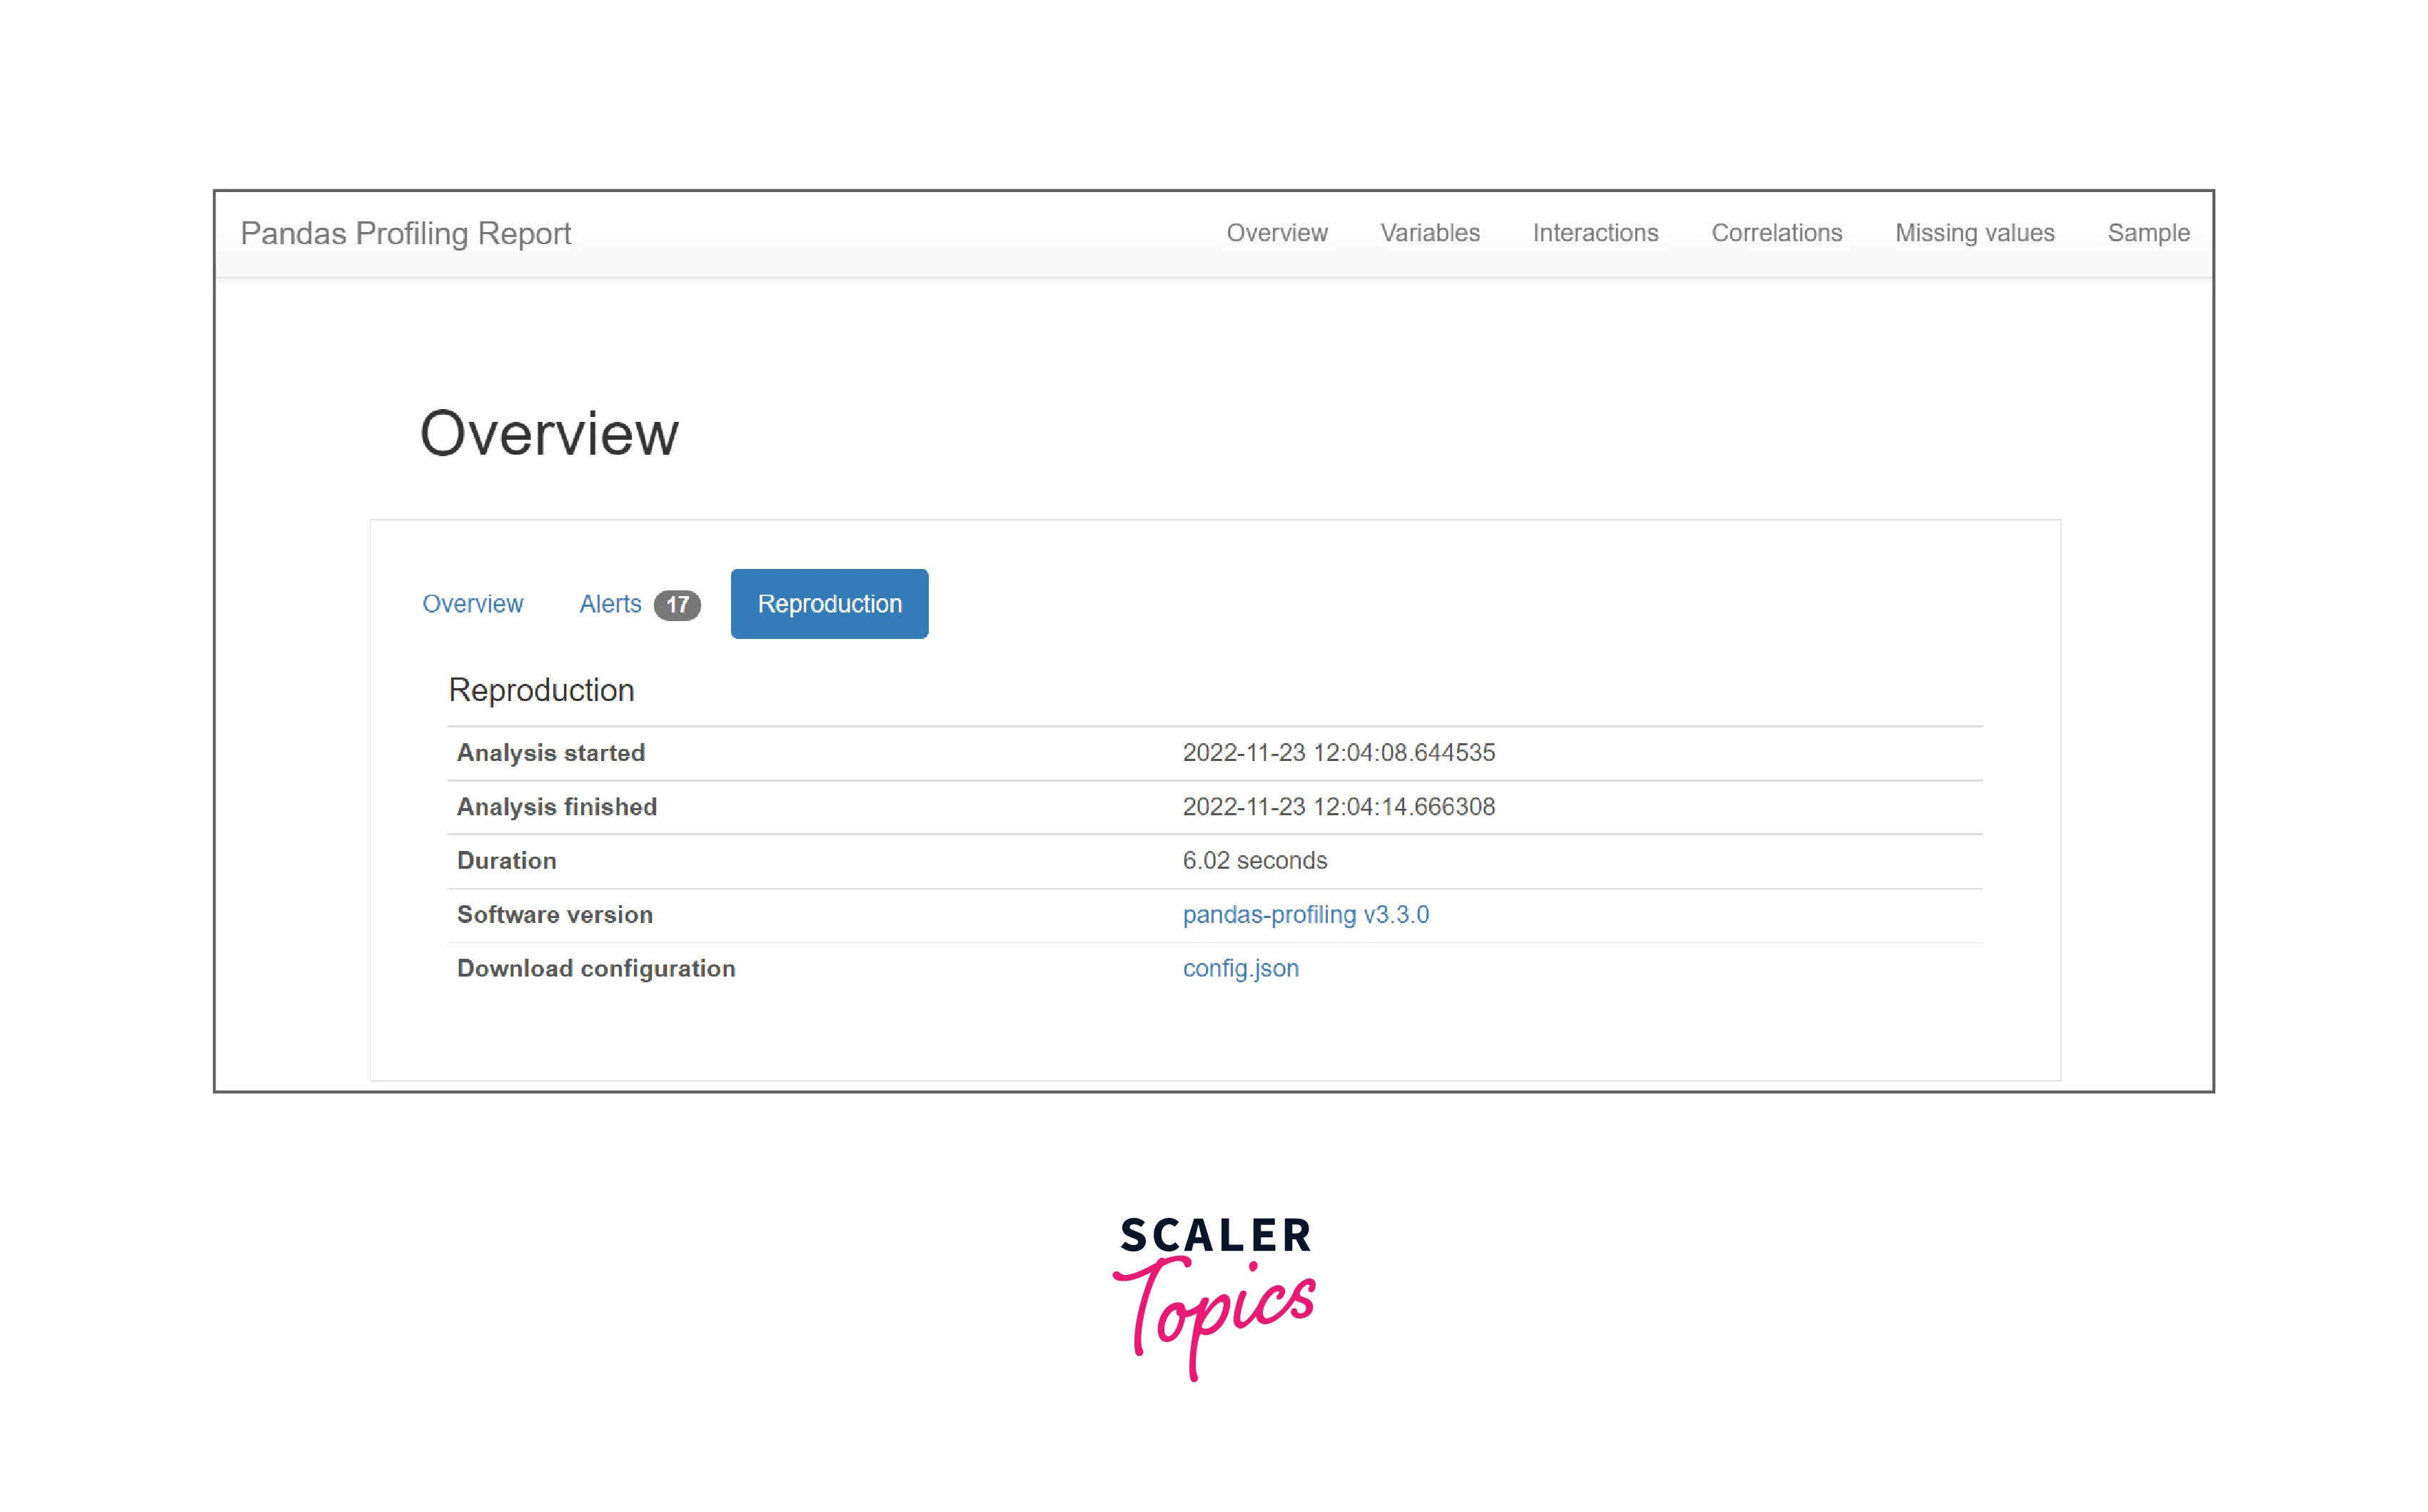
Reproduction: It includes all technical details about the data that has been analyzed such as analysis start time, analysis finish time, duration of analysis, its software version, and its download configuration.
The above-mentioned three sections are all covered under the overview and provide maximum details about the dataset. But there are other sections we need to look at such as Variables, Interactions, Correlations, Missing values, and samples.
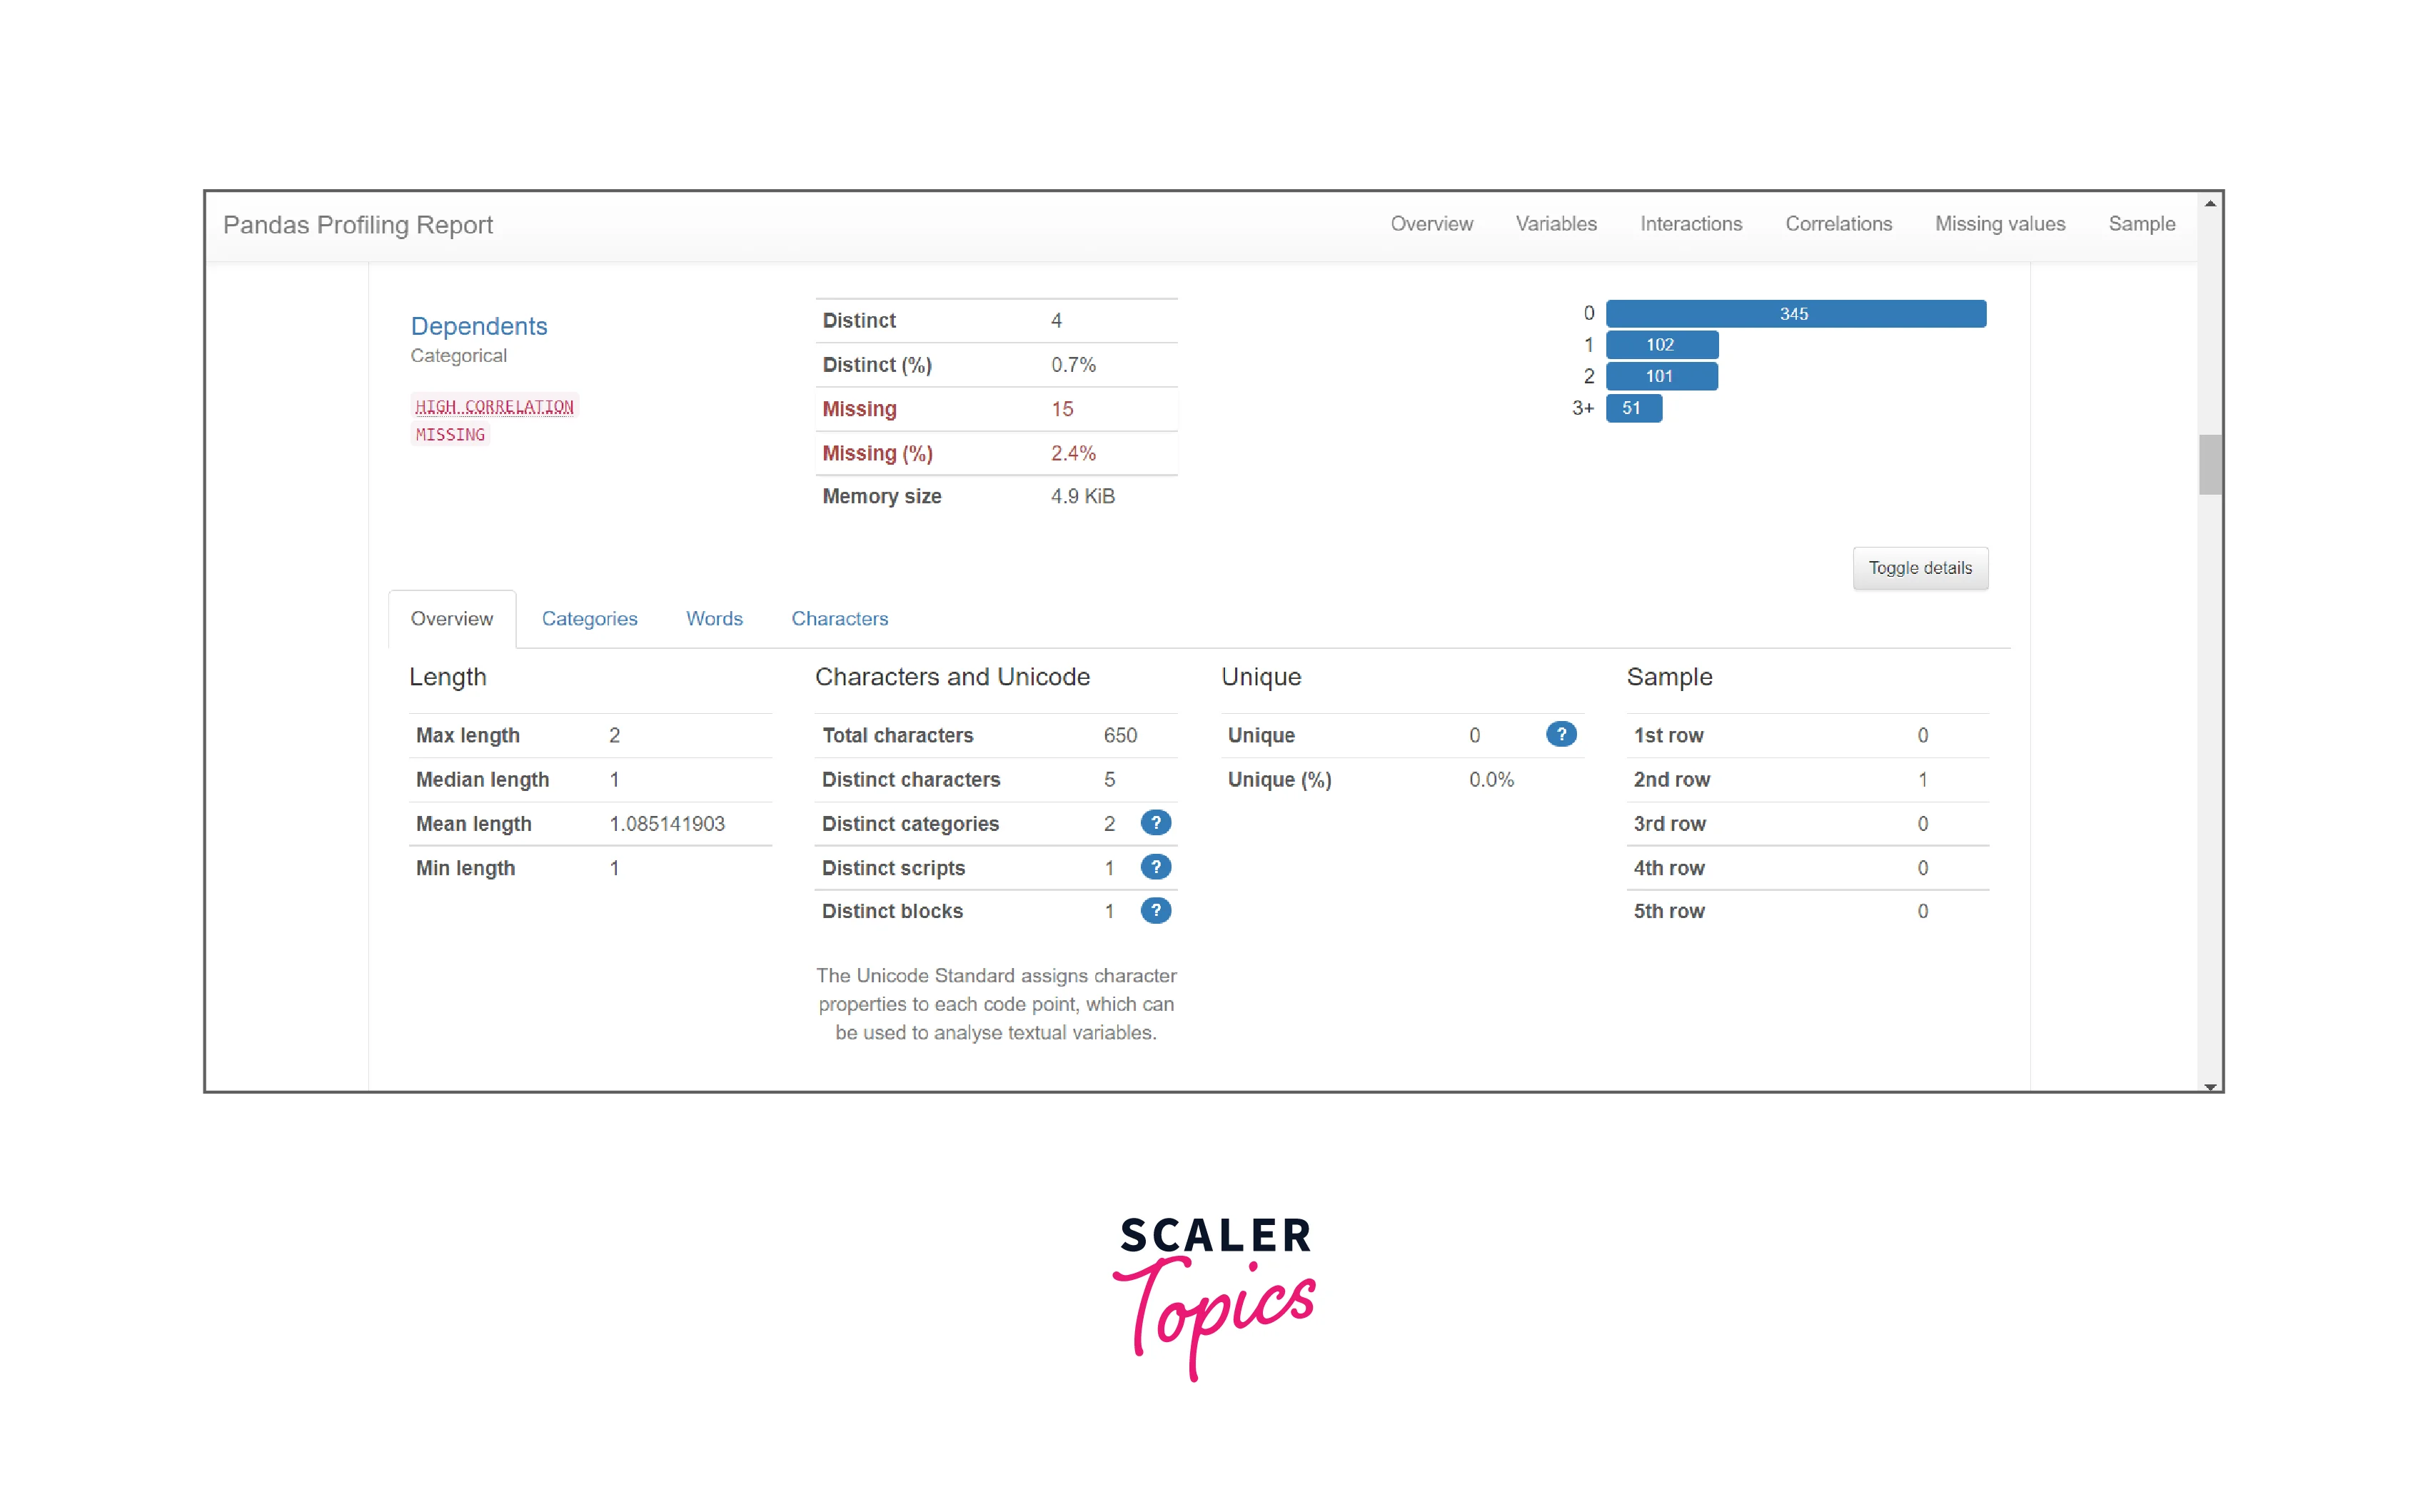
- Variables: It analyzes the columns for its data types. It can be categorical, numerical, or boolean.
- The definite data type is the String type here. To see a detailed view we need to click on the Toggle details button and it will list out an overview listing the total length, median length, characters Unicode, number of unique characters, etc.
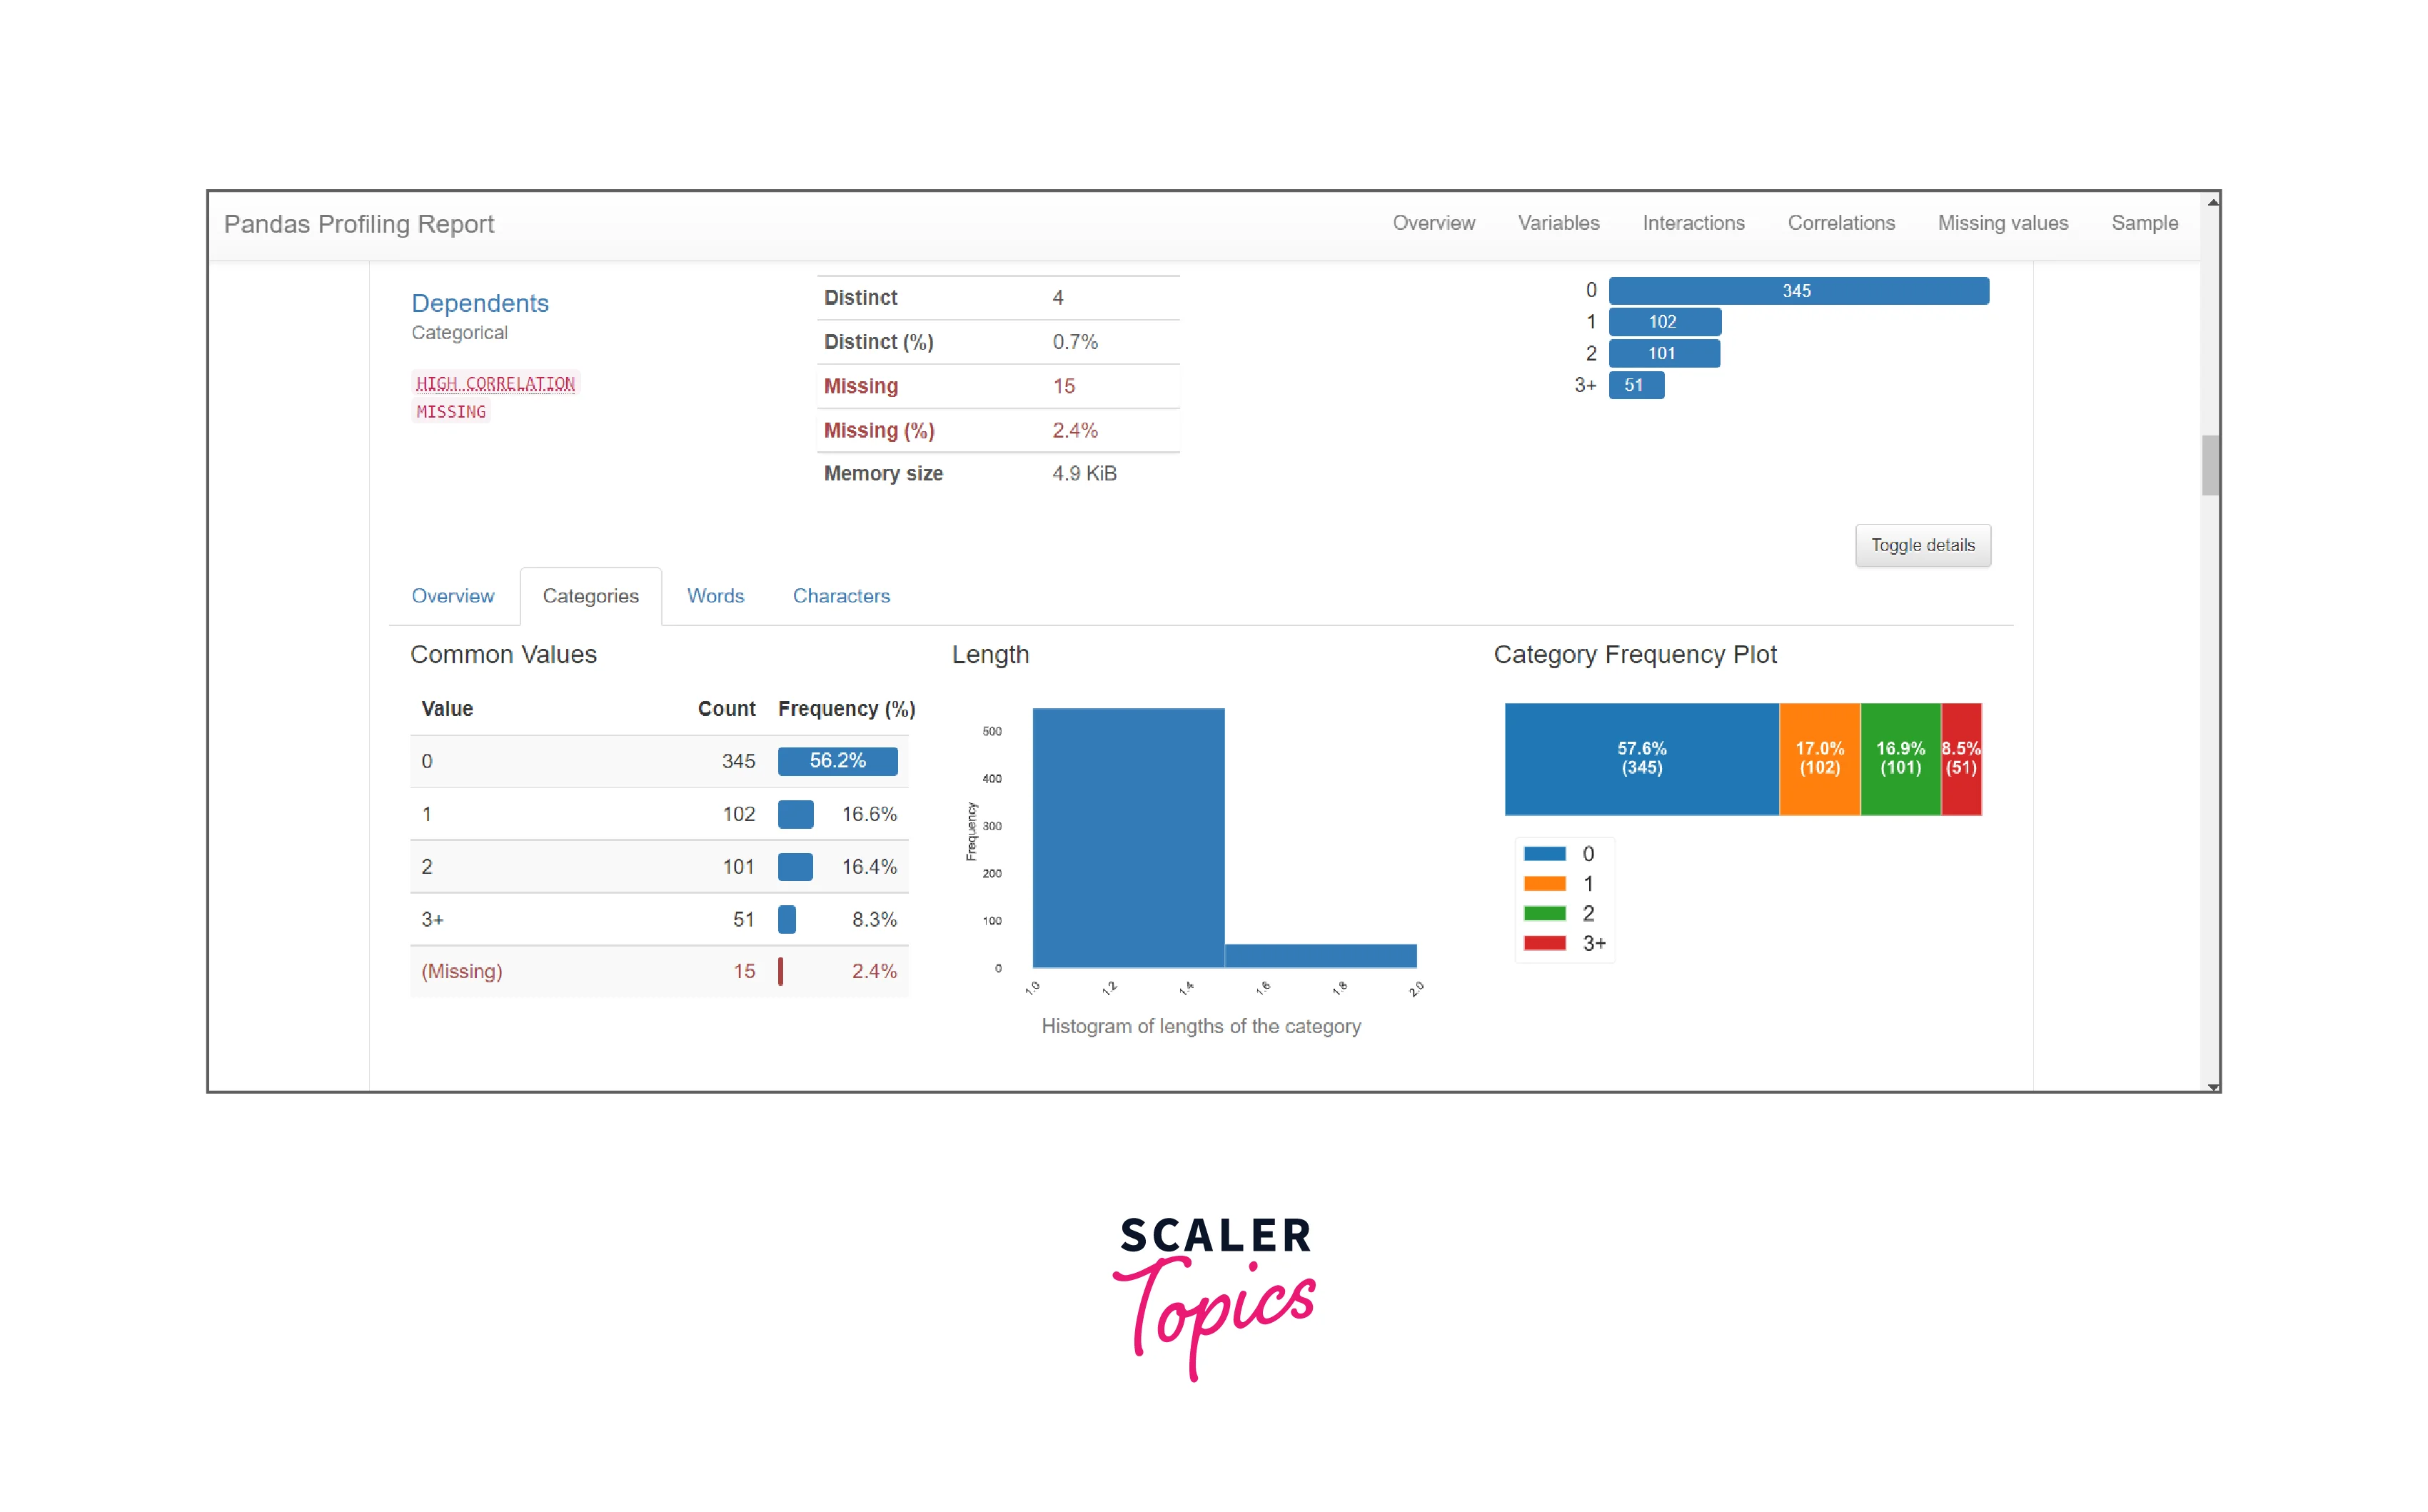
To see a histogram we need to click on categories and the frequency plot, histogram, etc will be shown.
-
The profiling of numerical data type is way more detailed in comparison to any other data type. It divides the report into two segments Quantile statistics and Descriptive statistics.
In quantile statistics it provides the statistical data regarding median quantile, percentile, etc. It also returns the minimum and maximum values within the dataset and the range between them. The quartile values Q1 and Q3 measure the distribution of the ordered values in the dataset above and below the median by dividing the set into four bins. The interquartile range is simply the results of quartile three minus quartile one(Q3-Q1).
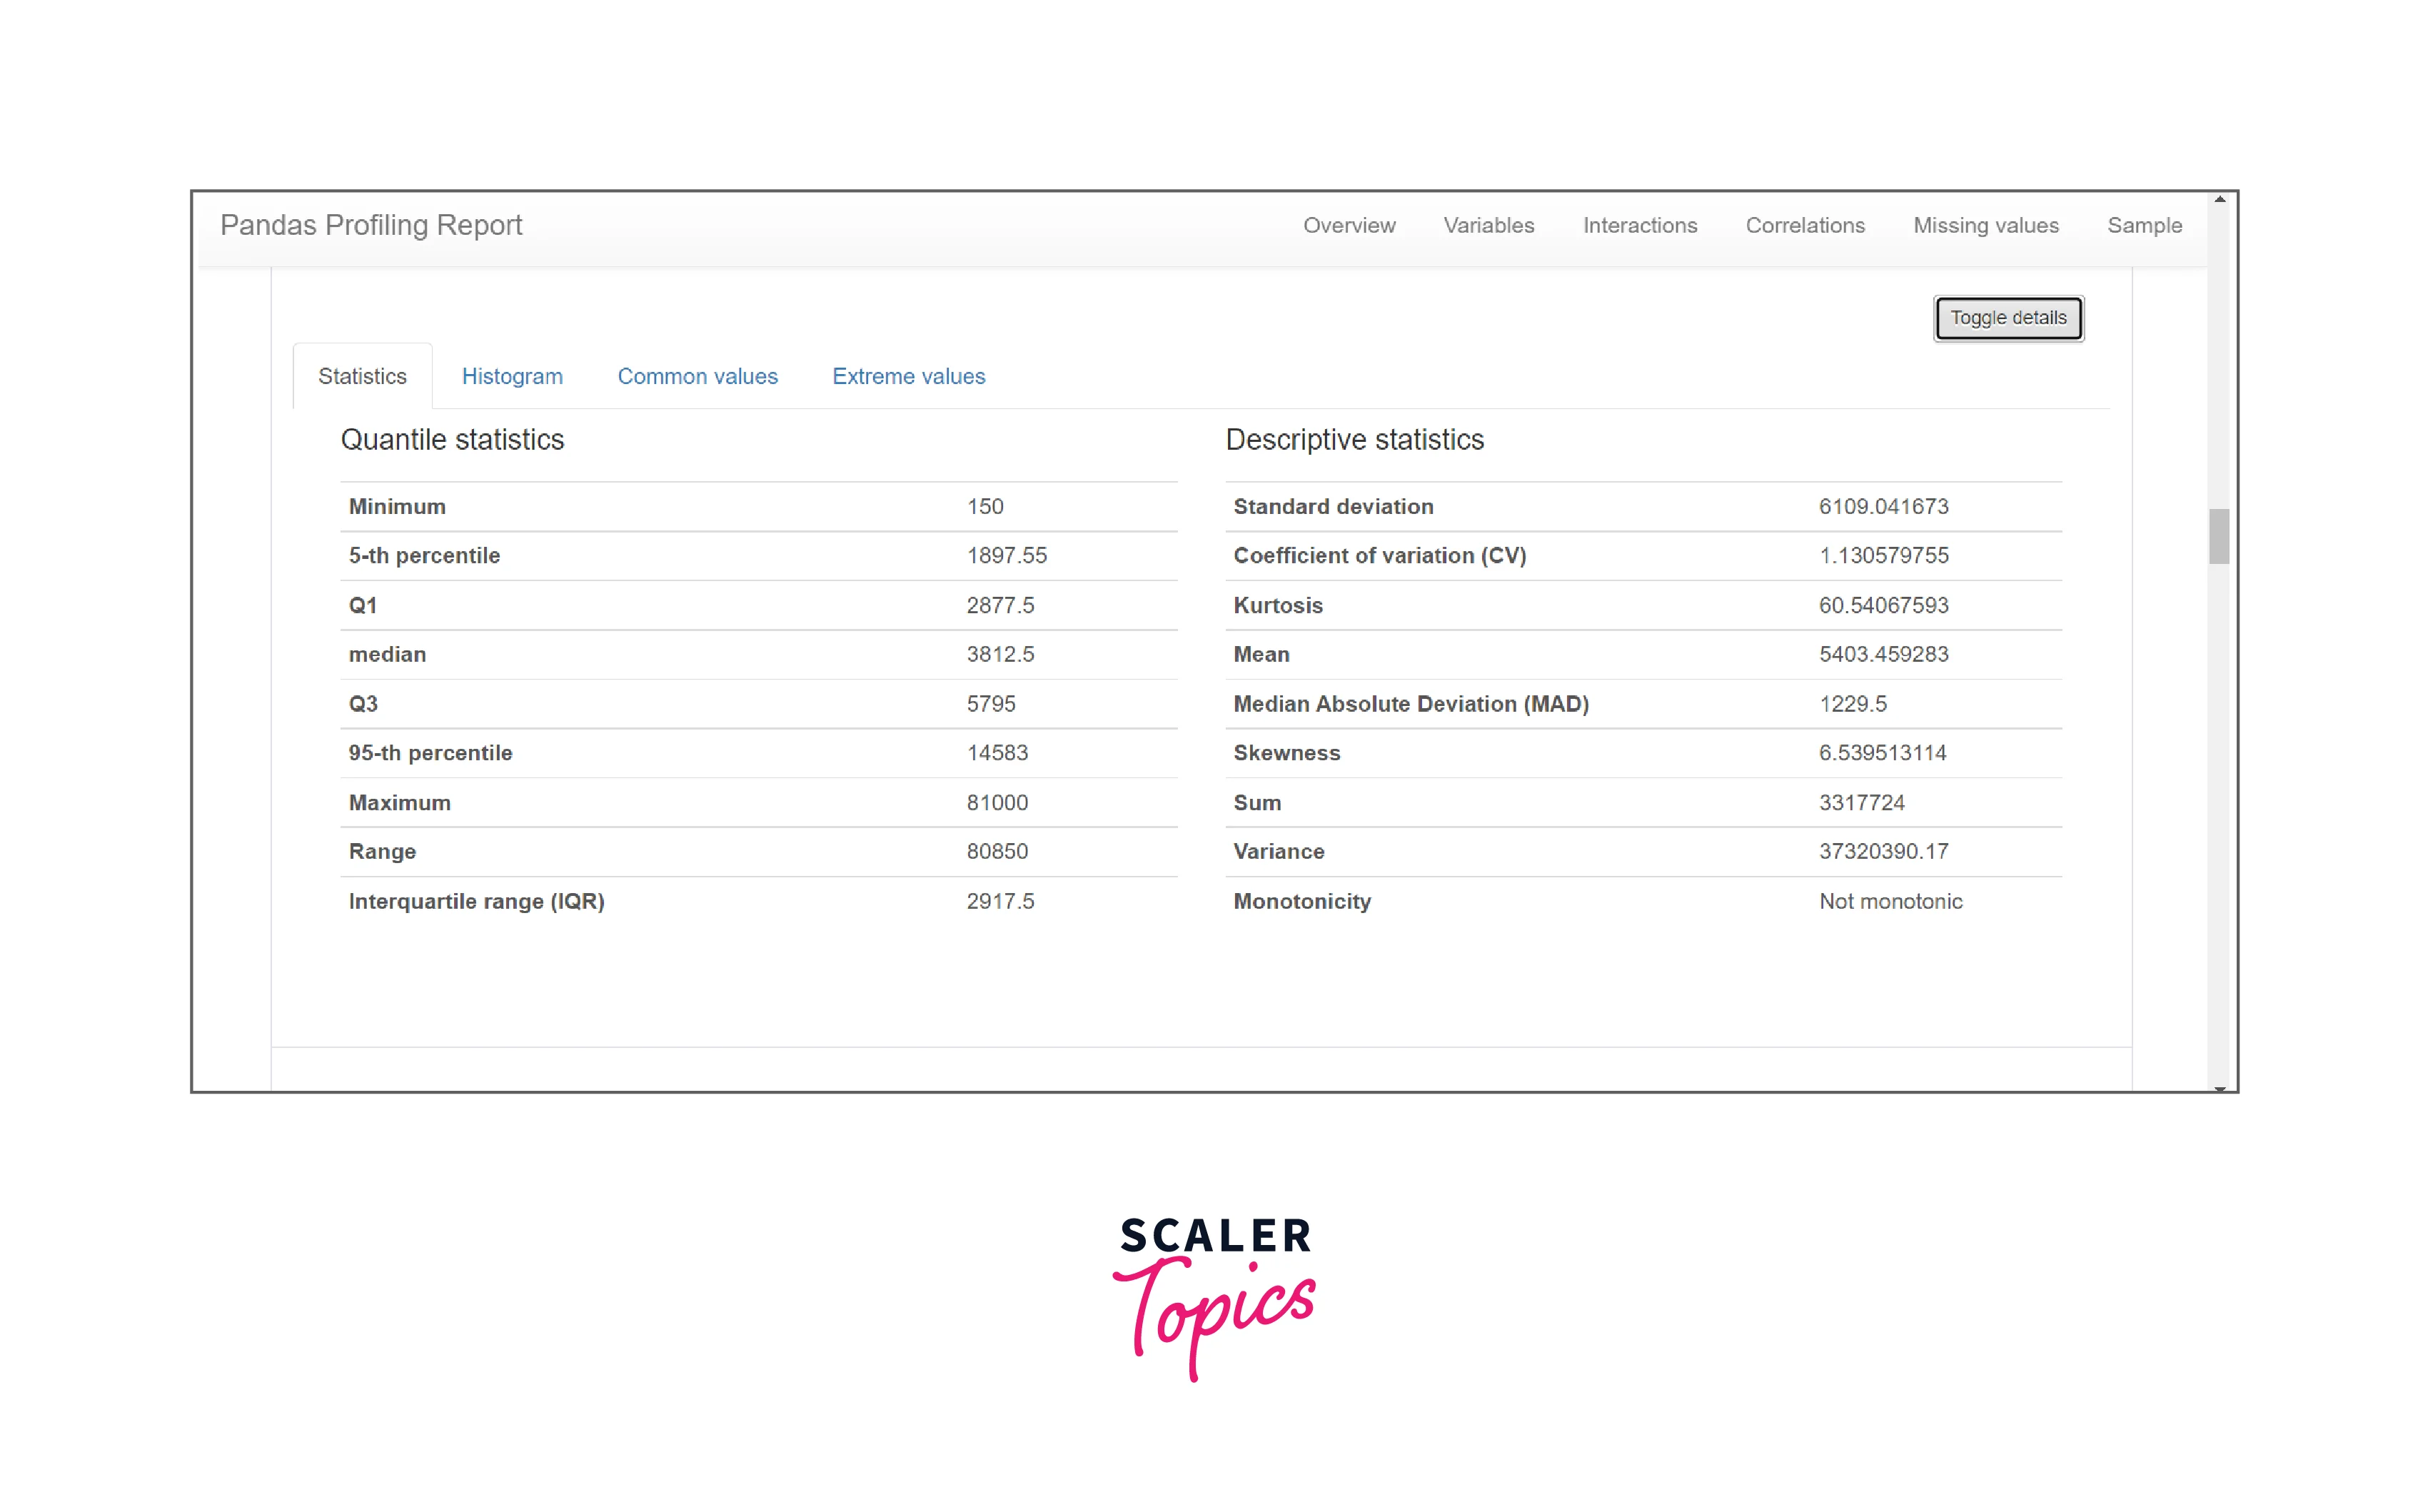
In descriptive statistics it provides values like Standard deviation, Coefficient of variation (CV), Kurtosis, Mean, Median Absolute Deviation (MAD), Skewness, Sum, Variance, and Monotonicity.
-
Standard deviation is defined as the method of reflecting the distribution of the whole dataset concerning its mean value. If the value of standard deviation is low it means that the values are closer to the mean value and a higher value which implies that the values are spread over a greater range and are far from the mean value.
-
The coefficient of variation(CV), also known as relative standard deviation, is the ratio of the standard deviation to the mean.
-
Kurtosis is used to describe the shape of the data by measuring the values within the tails of the distribution relative to the mean of the ordered dataset.
-
The median absolute deviation is another statistical measure that reflects the distribution of the data around the median.
-
Skewness reflects the level of distortion from a standard bell-shaped probability distribution. The numerical data is also represented in terms of histograms for numerical and categorical data.
-
-
Interaction and Correlations: The Interaction and Correlation section shows how the various features in a dataset are correlated to each other and how would they interact with each other when multiple measures are applied to it. It is represented using Seaborn Heatmap. This section is the one factor that sets pandas out of the crowd in terms of any exploratory data analysis tools. It analyses all the variables as pairs and highlights any highly correlating variables using Pearson, Spearman, Kendal, and Phik measures.
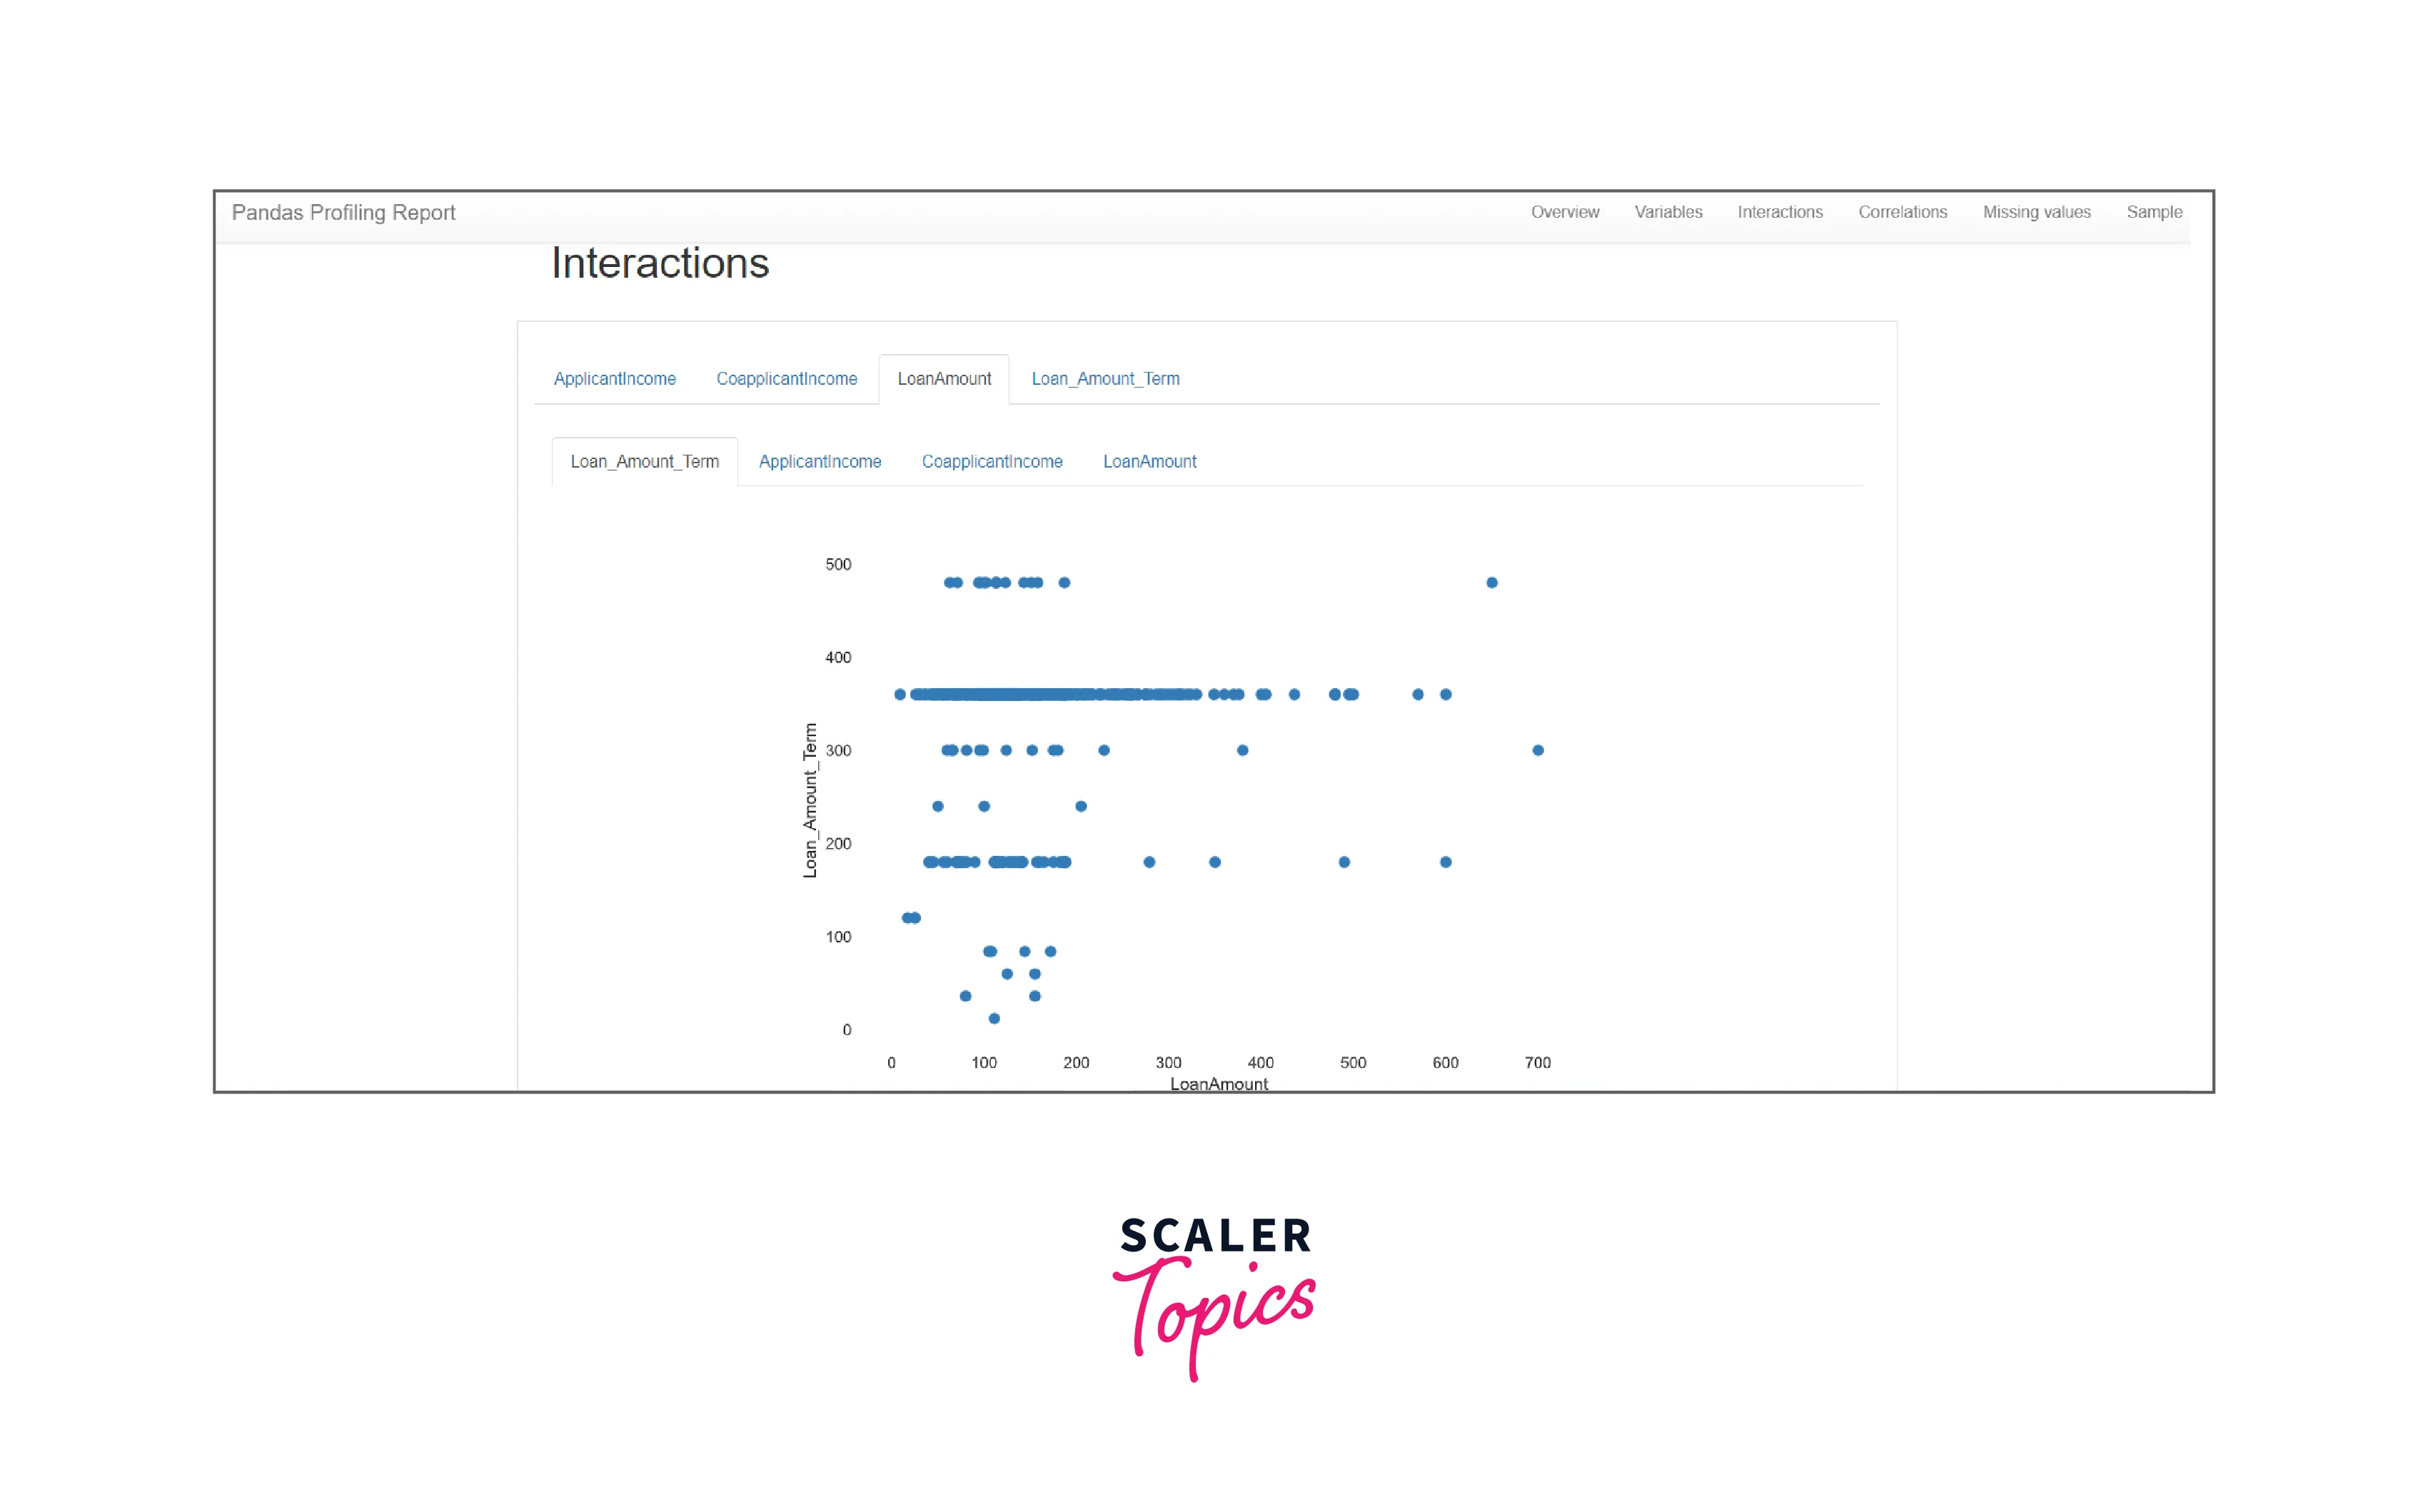
Note: Interactions show the relationship between two variables in the data frame as scatter plots.
Note: Correlation section provides a visualization of how features are correlated to each other with seaborn's heatmap.
-
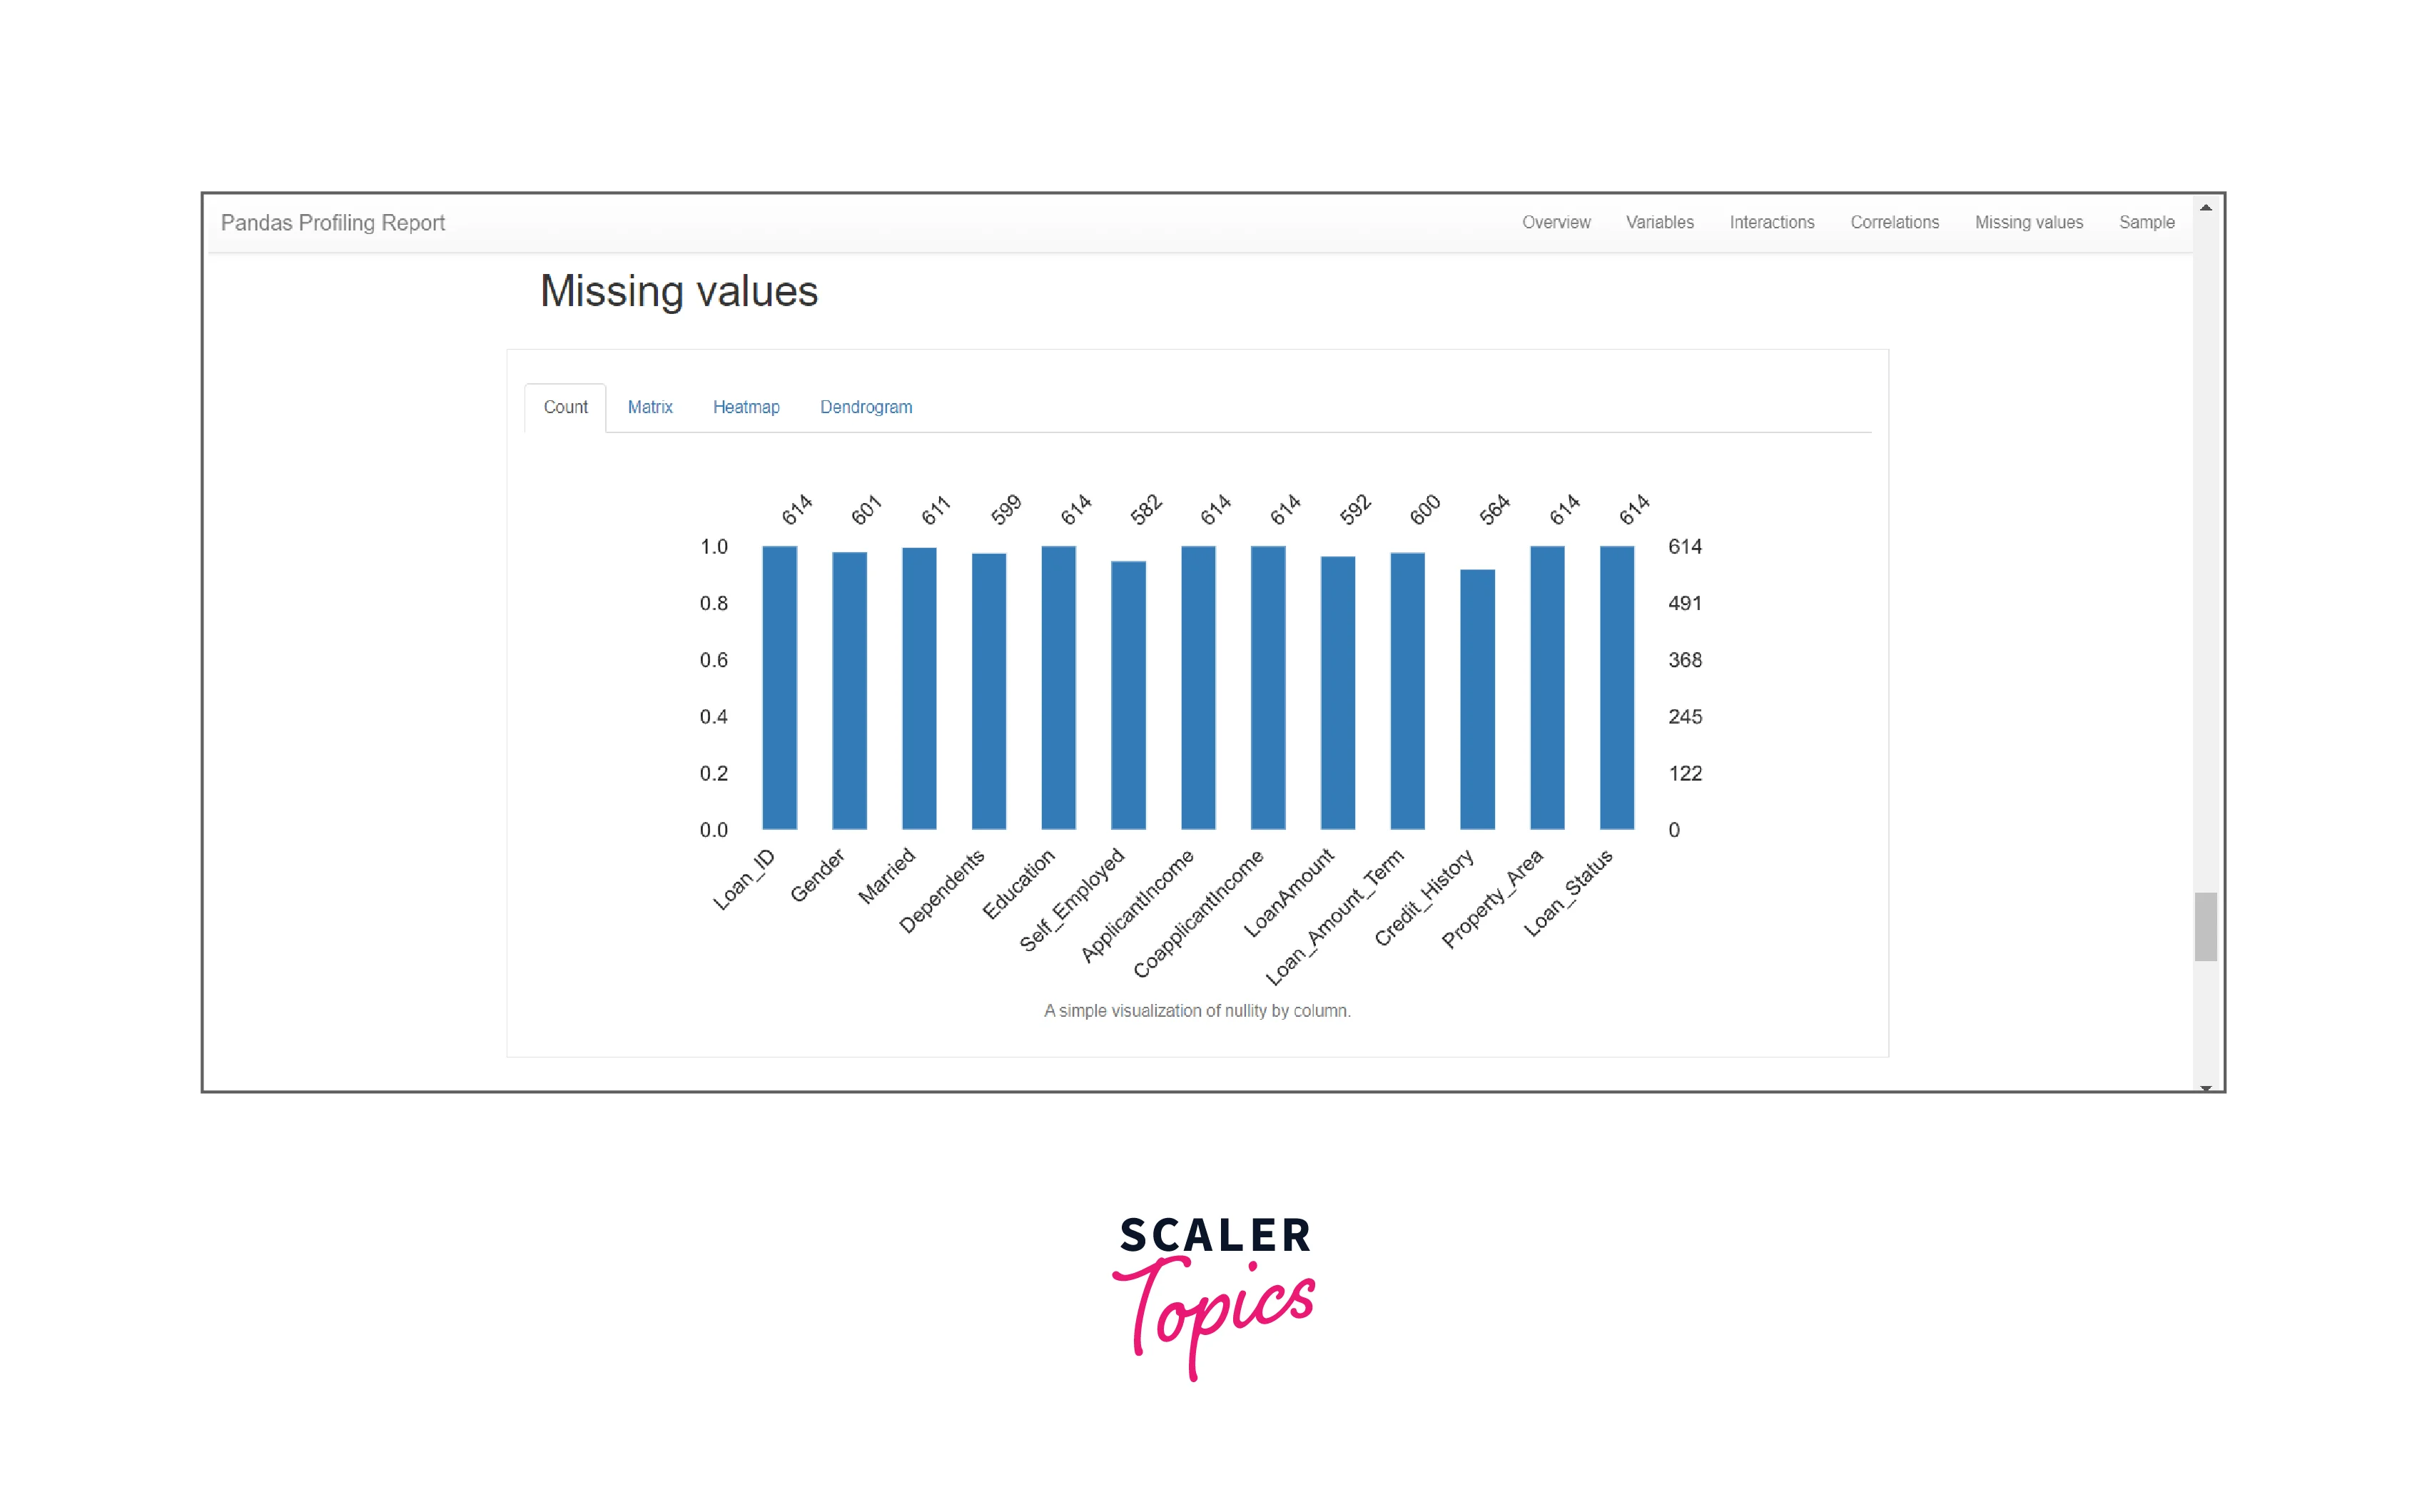
Missing Values The missing values for all column values in the dataset are represented using bar charts. It is represented in terms of count, matrix, heatmaps, and dendrograms.
-
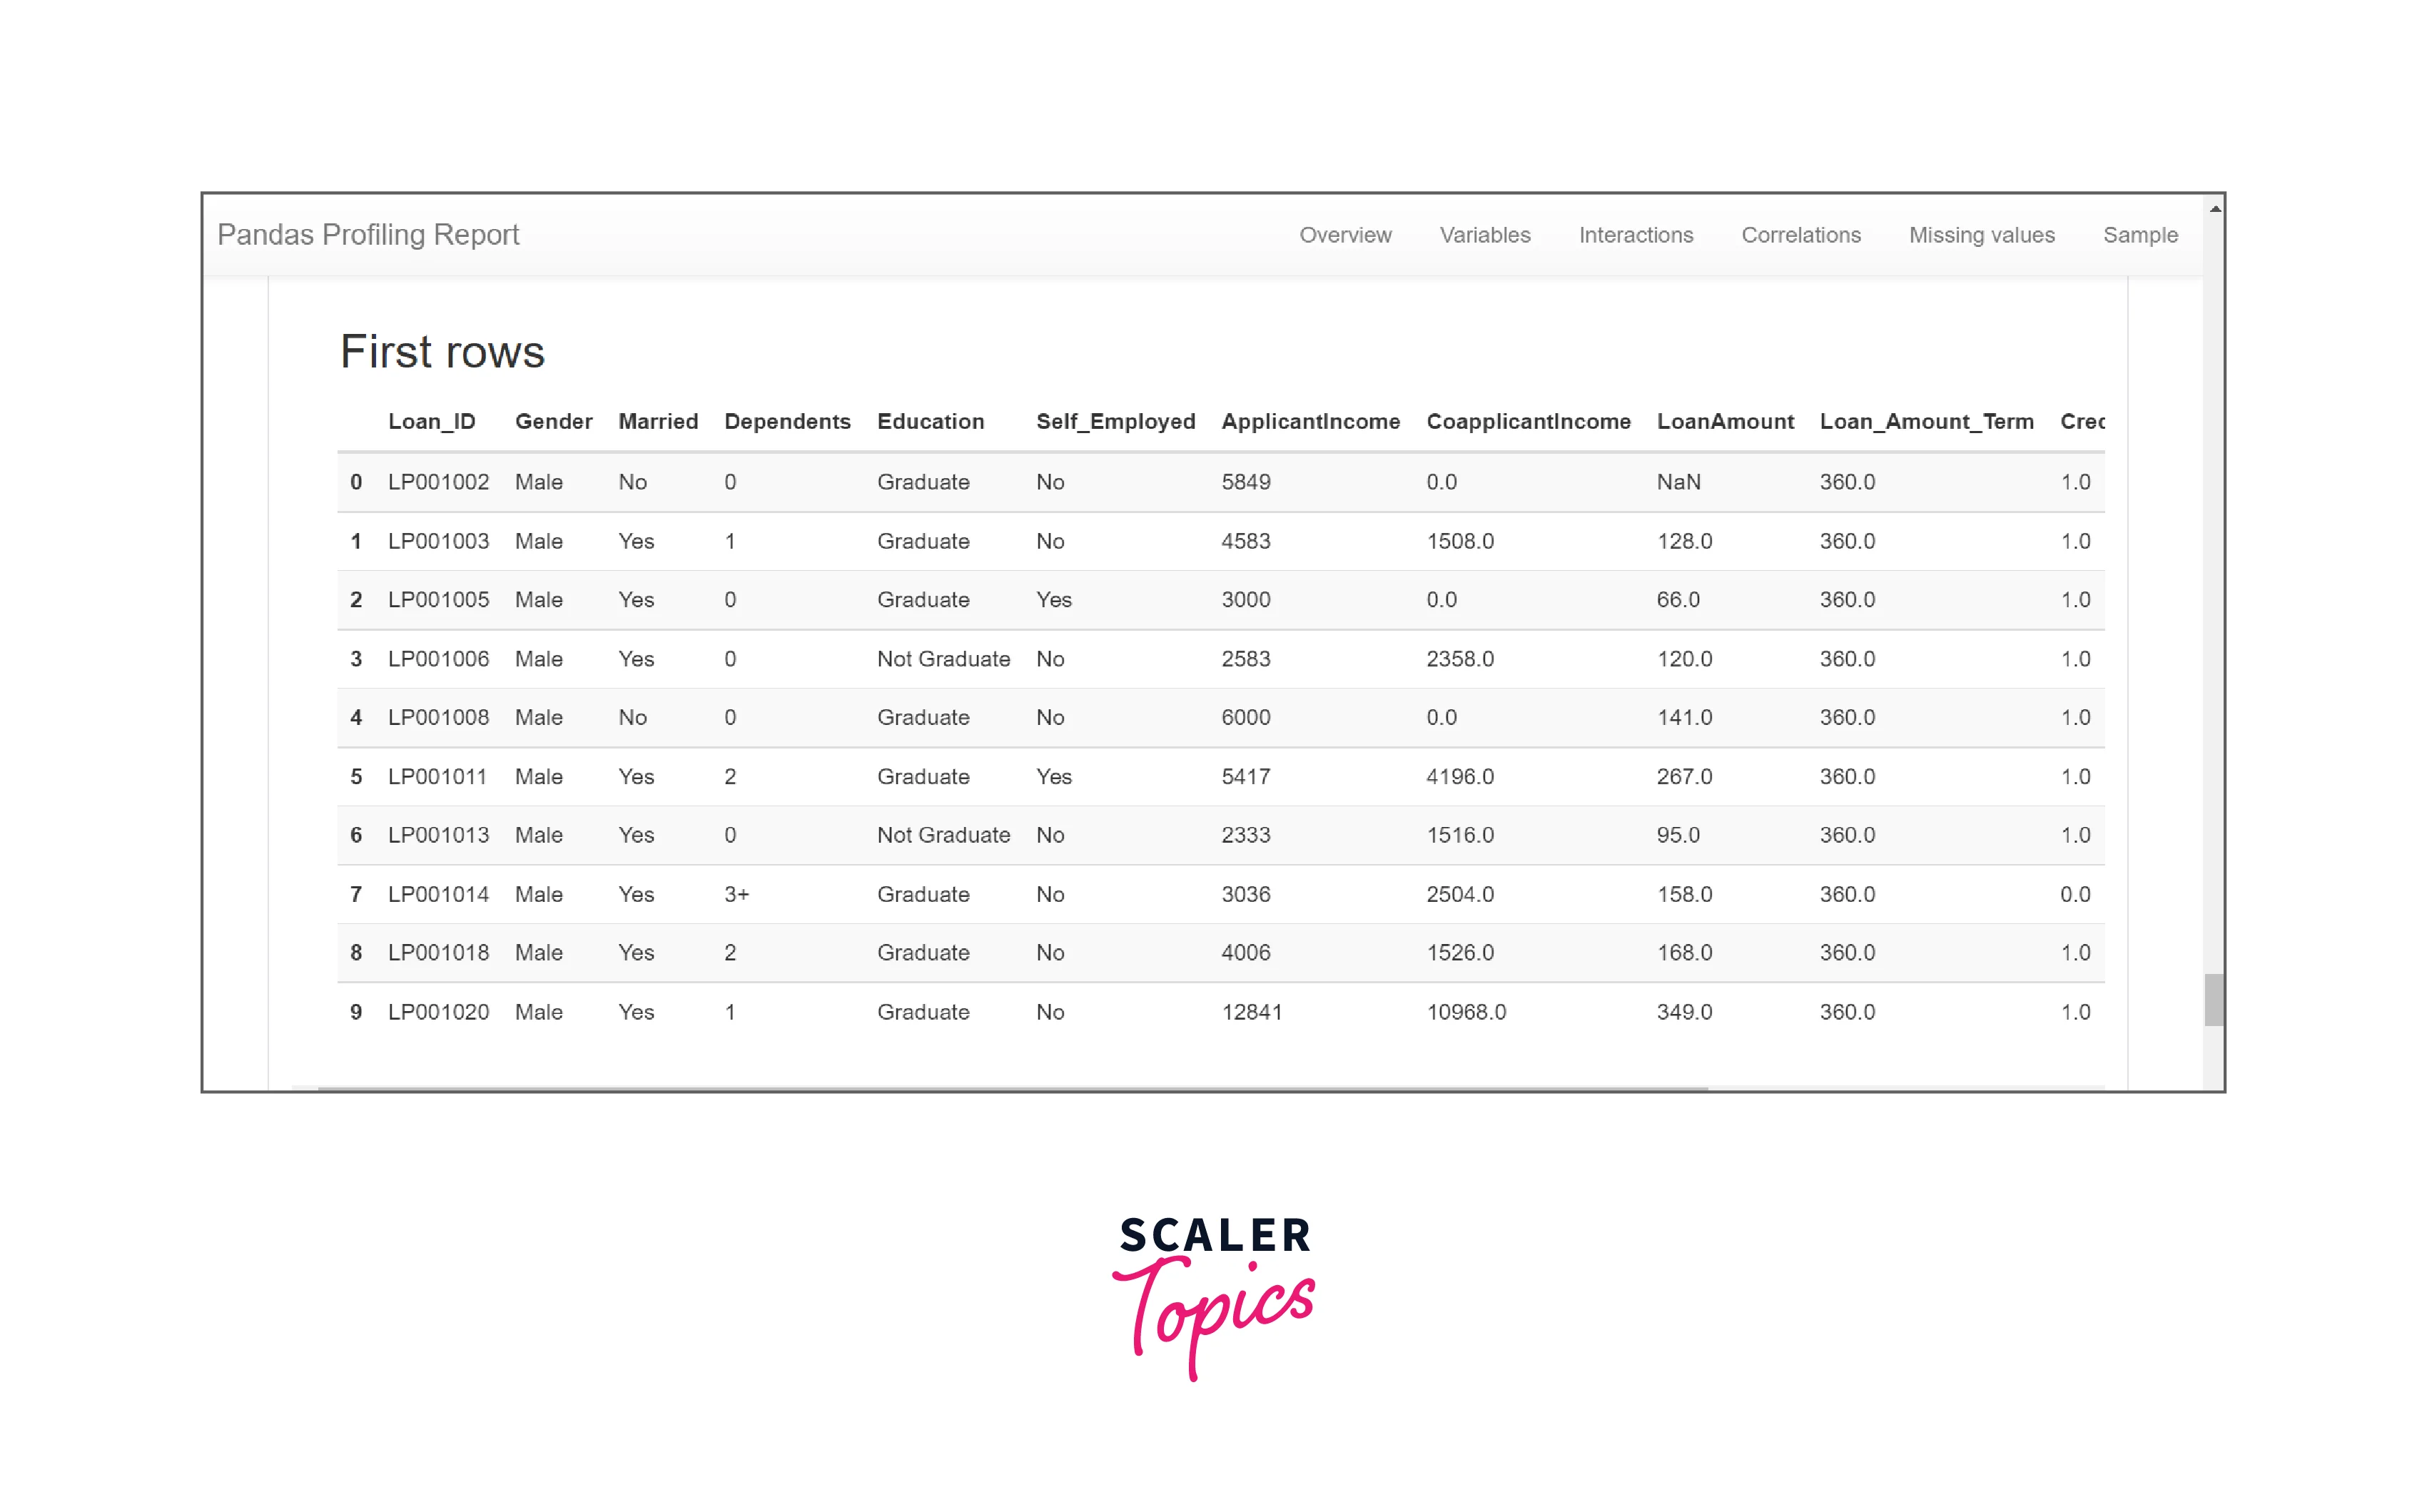
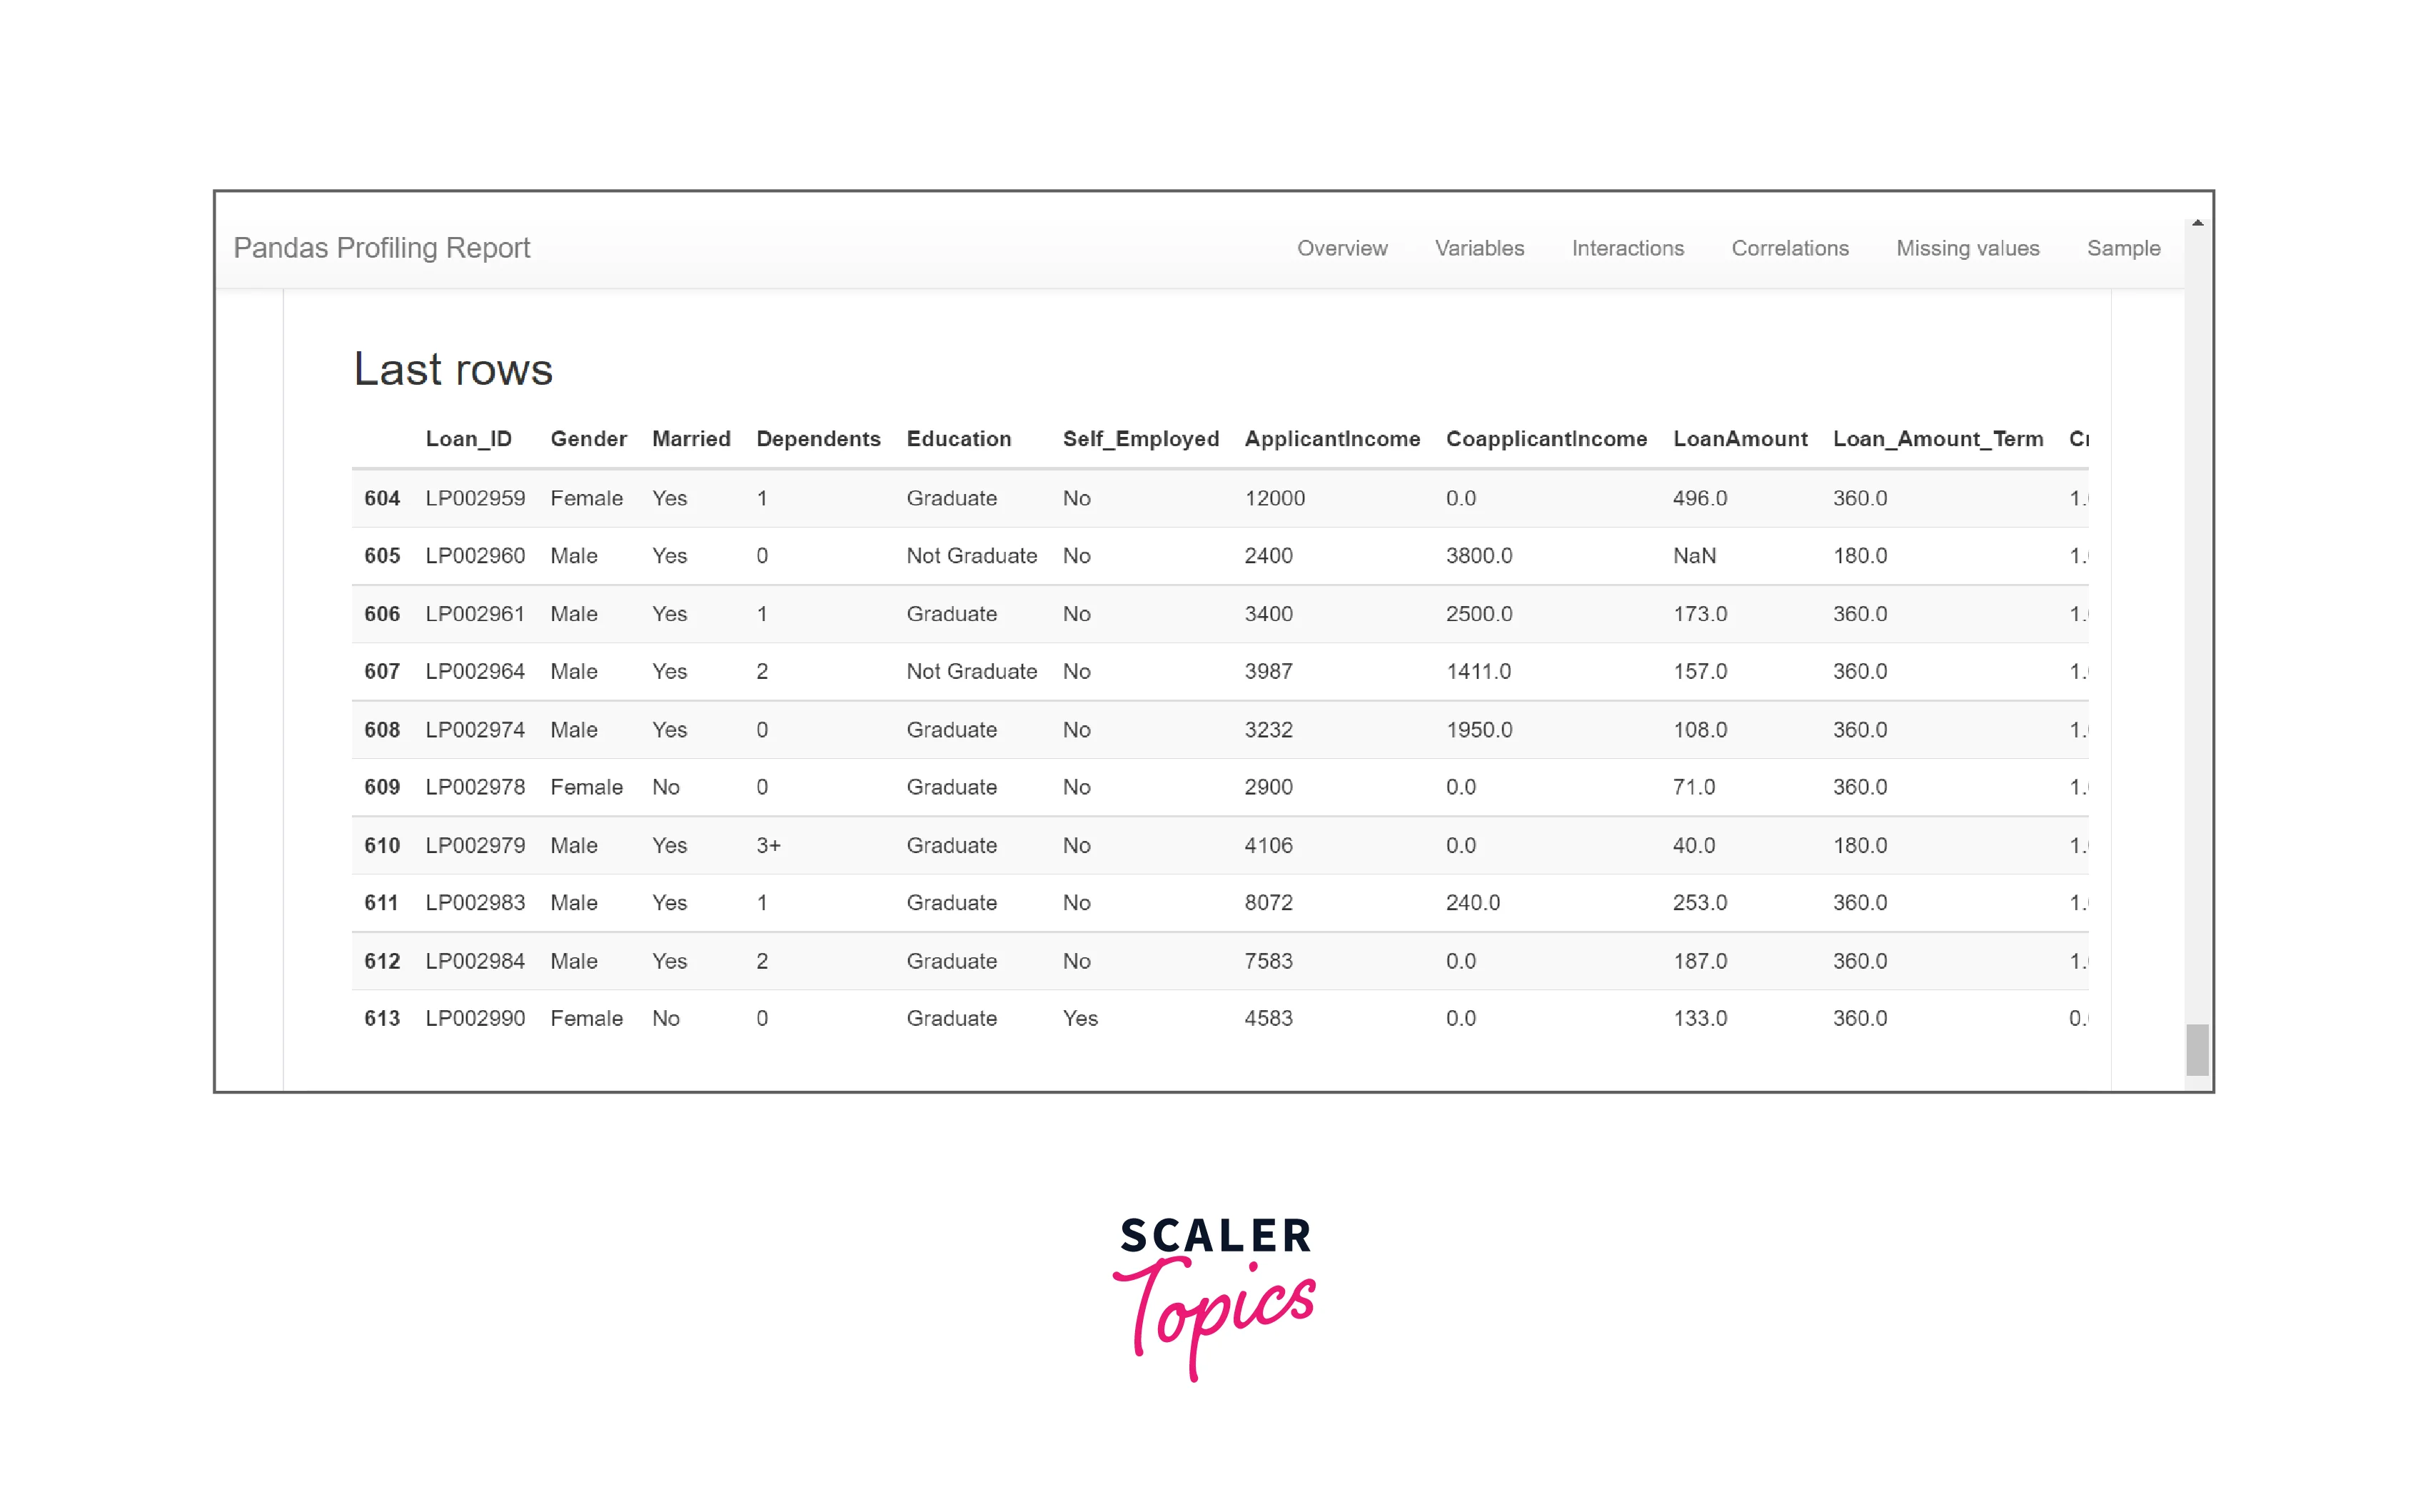
Sample Section The sample section displays the first and last ten rows of the dataset. The dataset may or may not be ordered.
Conclusion
Pandas profiling is an important tool when working with a huge amount of data. Let us take a quick recap on the pandas-profiling method, its syntax, functionalities, etc.
- Pandas profiling is used to generate profile reports from a pandas DataFrame.
- It generates two different report formats HTML and JSON.
- The report contains three major sections, Overview gives us an overall idea about the missing values, the duplicate rows, the total number of observations, etc. Alerts section gives us an idea about the possible issues or warnings existing in the dataset is its high cardinality, missing values, number of zeroes, etc. Reproduction gives us an idea in terms of technical aspects of the report such as analysis start and end time, the total duration of analysis, the version, etc.
- In the end we looked into some other sections such as variables, interaction and correlation, missing values, and samples. The variable section gave us an overview of the types of variables and their frequency charts. The interaction and correlation showed the dependency between the variables as pairs. The missing value represented all missing values in the dataset in four different forms. The sample section gave us an overview of the dataset by returning the first and last ten rows of the dataset.
