SQL vs Pandas
Learn via video courses
Overview
With a sudden boom in the domain of Data Science and Data Analysis, it becomes essential to know the difference between the two most popular tools out there to analyze the data. For example, how they differ operation-wise, performance-wise, etc.
Scope
- The difference between Pandas and SQL has been discussed in brief.
- The article consists of the operation-wise difference between Pandas and SQL throughout the article.
- Specific use cases of both tools have been clearly mentioned.
Introduction
Both Pandas and SQL are one of the most important tools for people working in the domain of data science, data analytics, business intelligence, etc. Pandas is an open-source Python library that is extensively used for data analysis and manipulation. In contrast, SQL is a programming language that is used to perform operations in the relational database management system (RDBMS). The only thing that Pandas and SQL share in common is that they both operate on data that is represented as a table , rows and columns.
Differentiate between Pandas and SQL
| Pandas | SQL |
|---|---|
| Open source library of Python programming language | It is a programming language |
| Generally, it is used to read .csv data | It reads data stored in an RDBMS |
| It may lag in fetching large volumes of data | It is optimized for querying data |
| Huge set of inbuilt functions | Only basic inbuilt functions are there |
| It is easy to perform complex operations | Performing complex operations isn't that easy |
Operations-Wise Difference
Before seeing the differences between the operations. Let us see the data we will be taking into consideration for all of the following examples. We will be taking the Titanic Dataset to test all our operations. You can also download the dataset for free and test it on your machine.
Overview of Data
To get an overview of the data in SQL, we simply use DESC tableName to print all the details about the data contained in the table.
Code:
Output:
We have got all the column names, their type, and one additional information, NULL? whether the value in the record of a particular column can be null or not.
While in Pandas we use "dataset.describe()", where 'dataset' is the name of the pandas' dataframe.
Code:
Output:
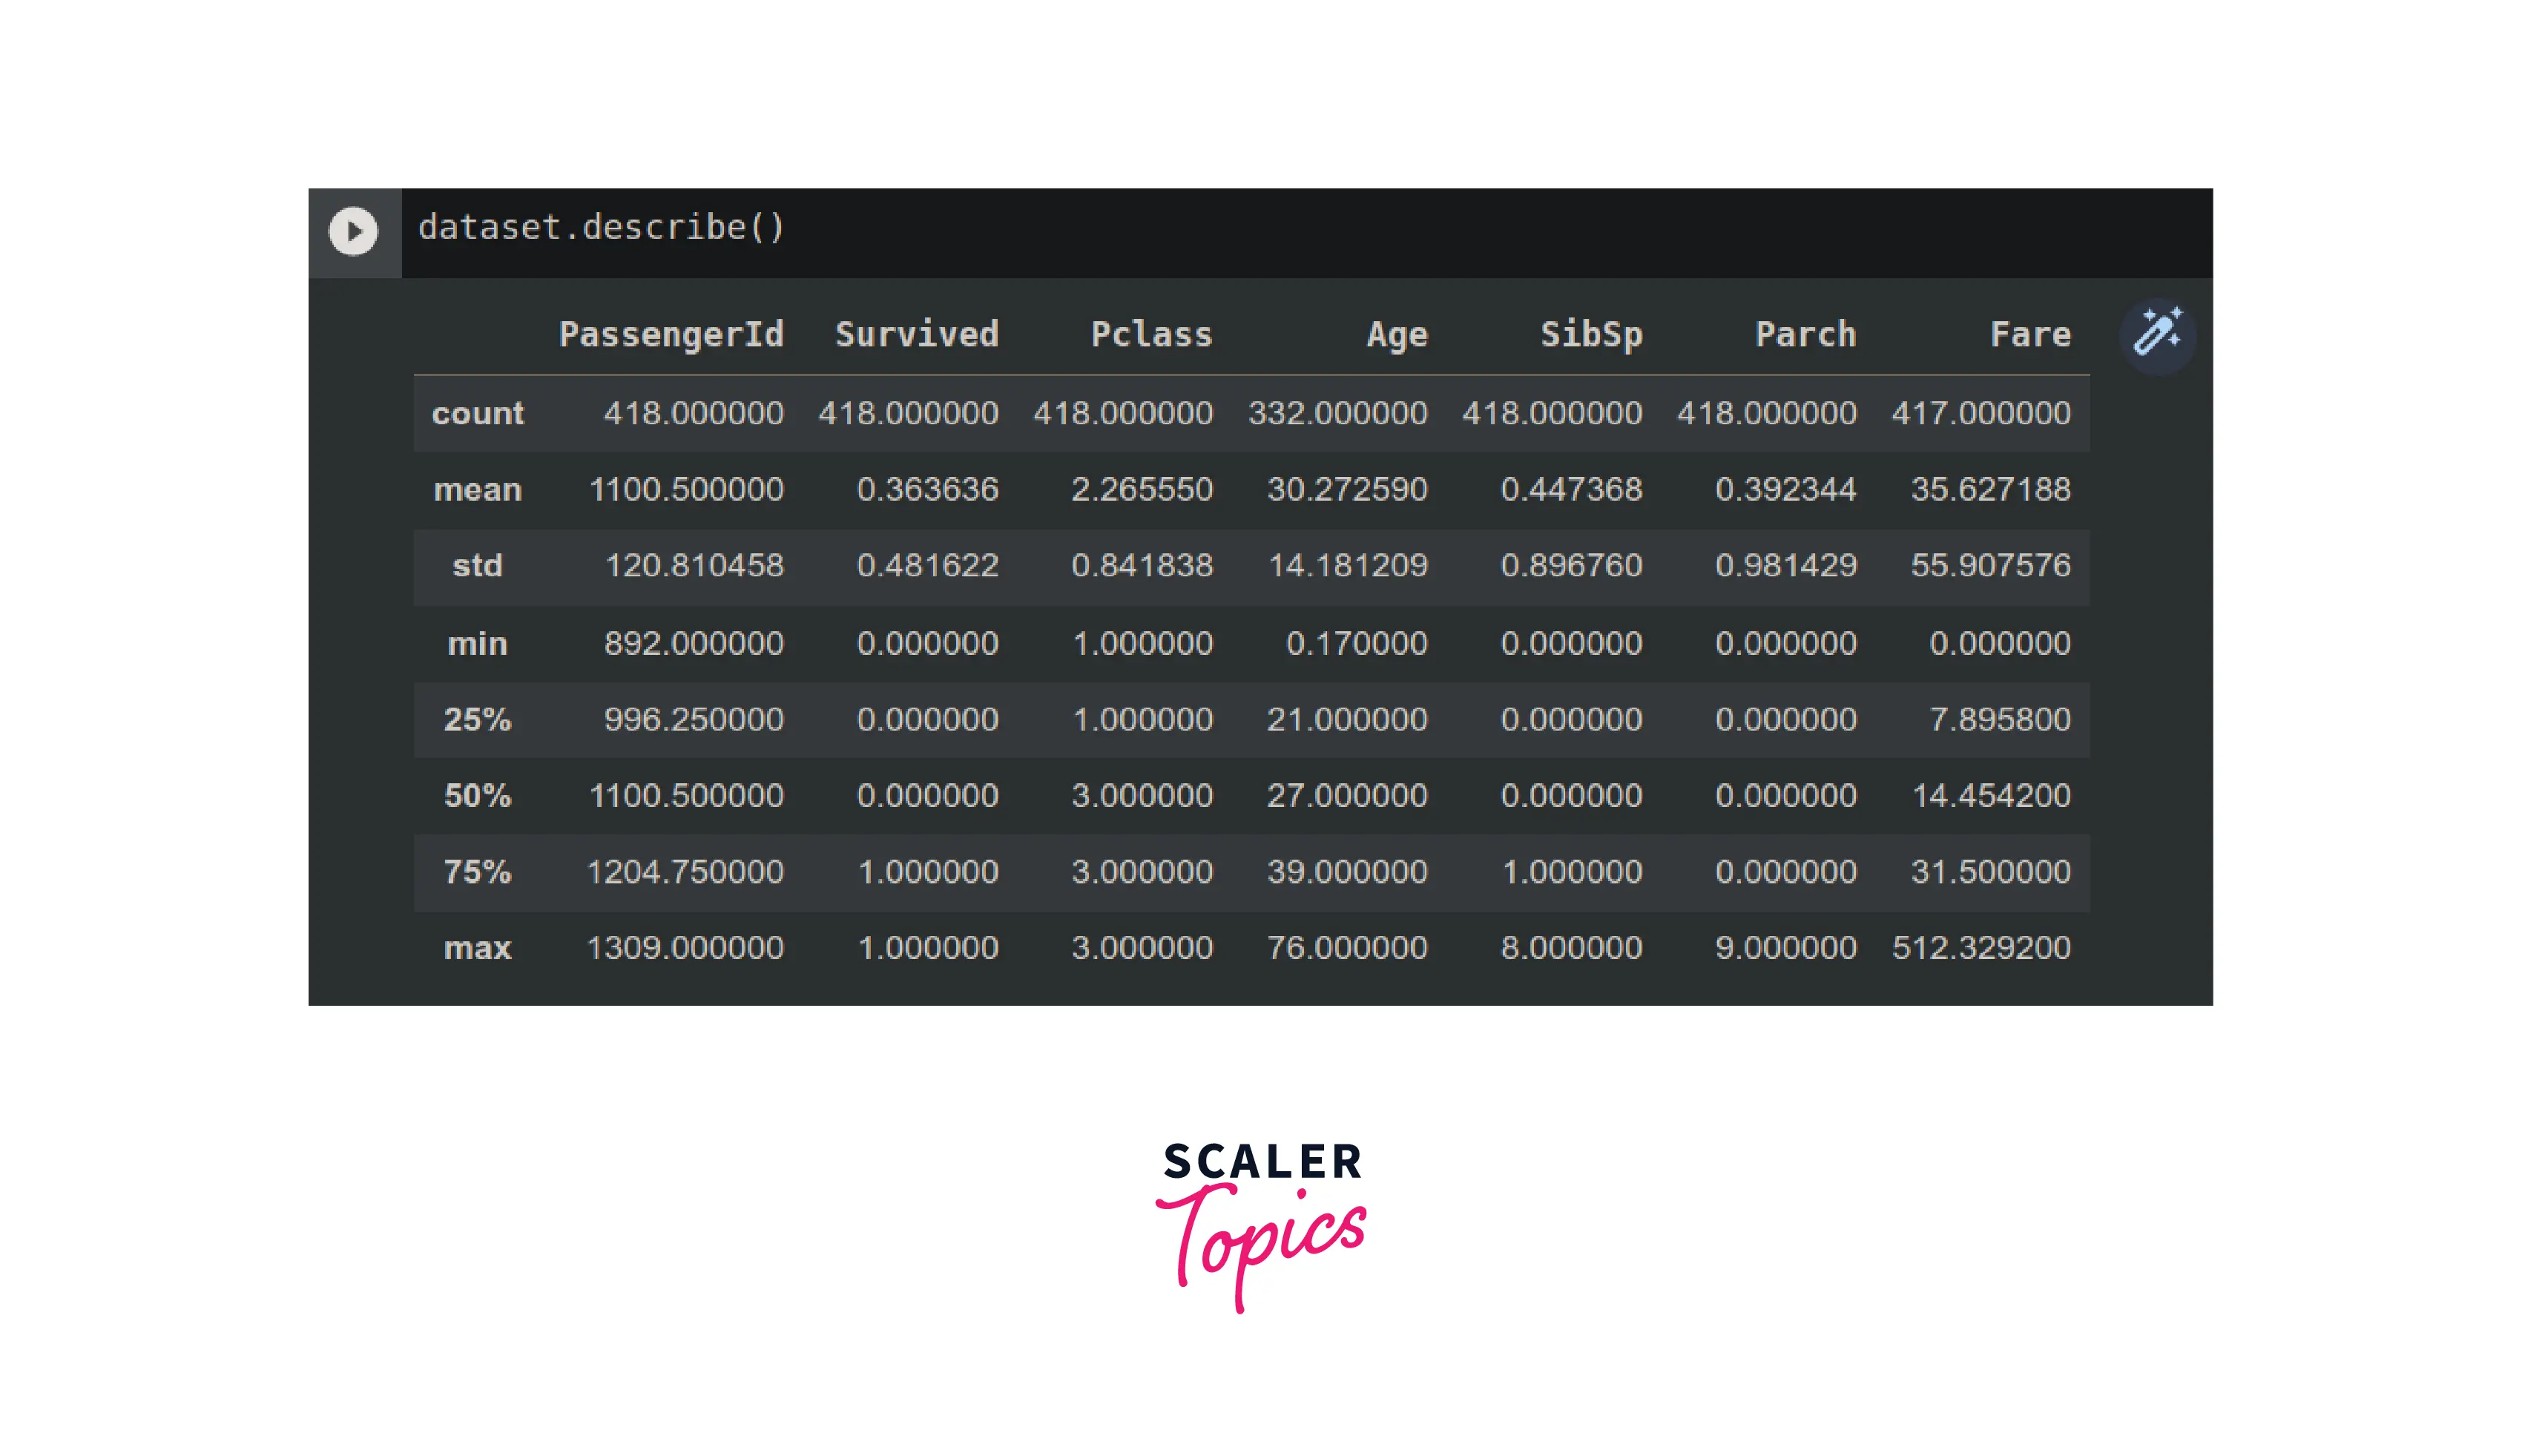
As you can see, we have got all the statistical information about all the columns (or fields) of the data.
Displaying the First 5 Rows
Displaying the first 5 records of the table in SQL requires the LIMIT clause. As the name suggests, it limits the content displayed as the output.
Code:
Output:
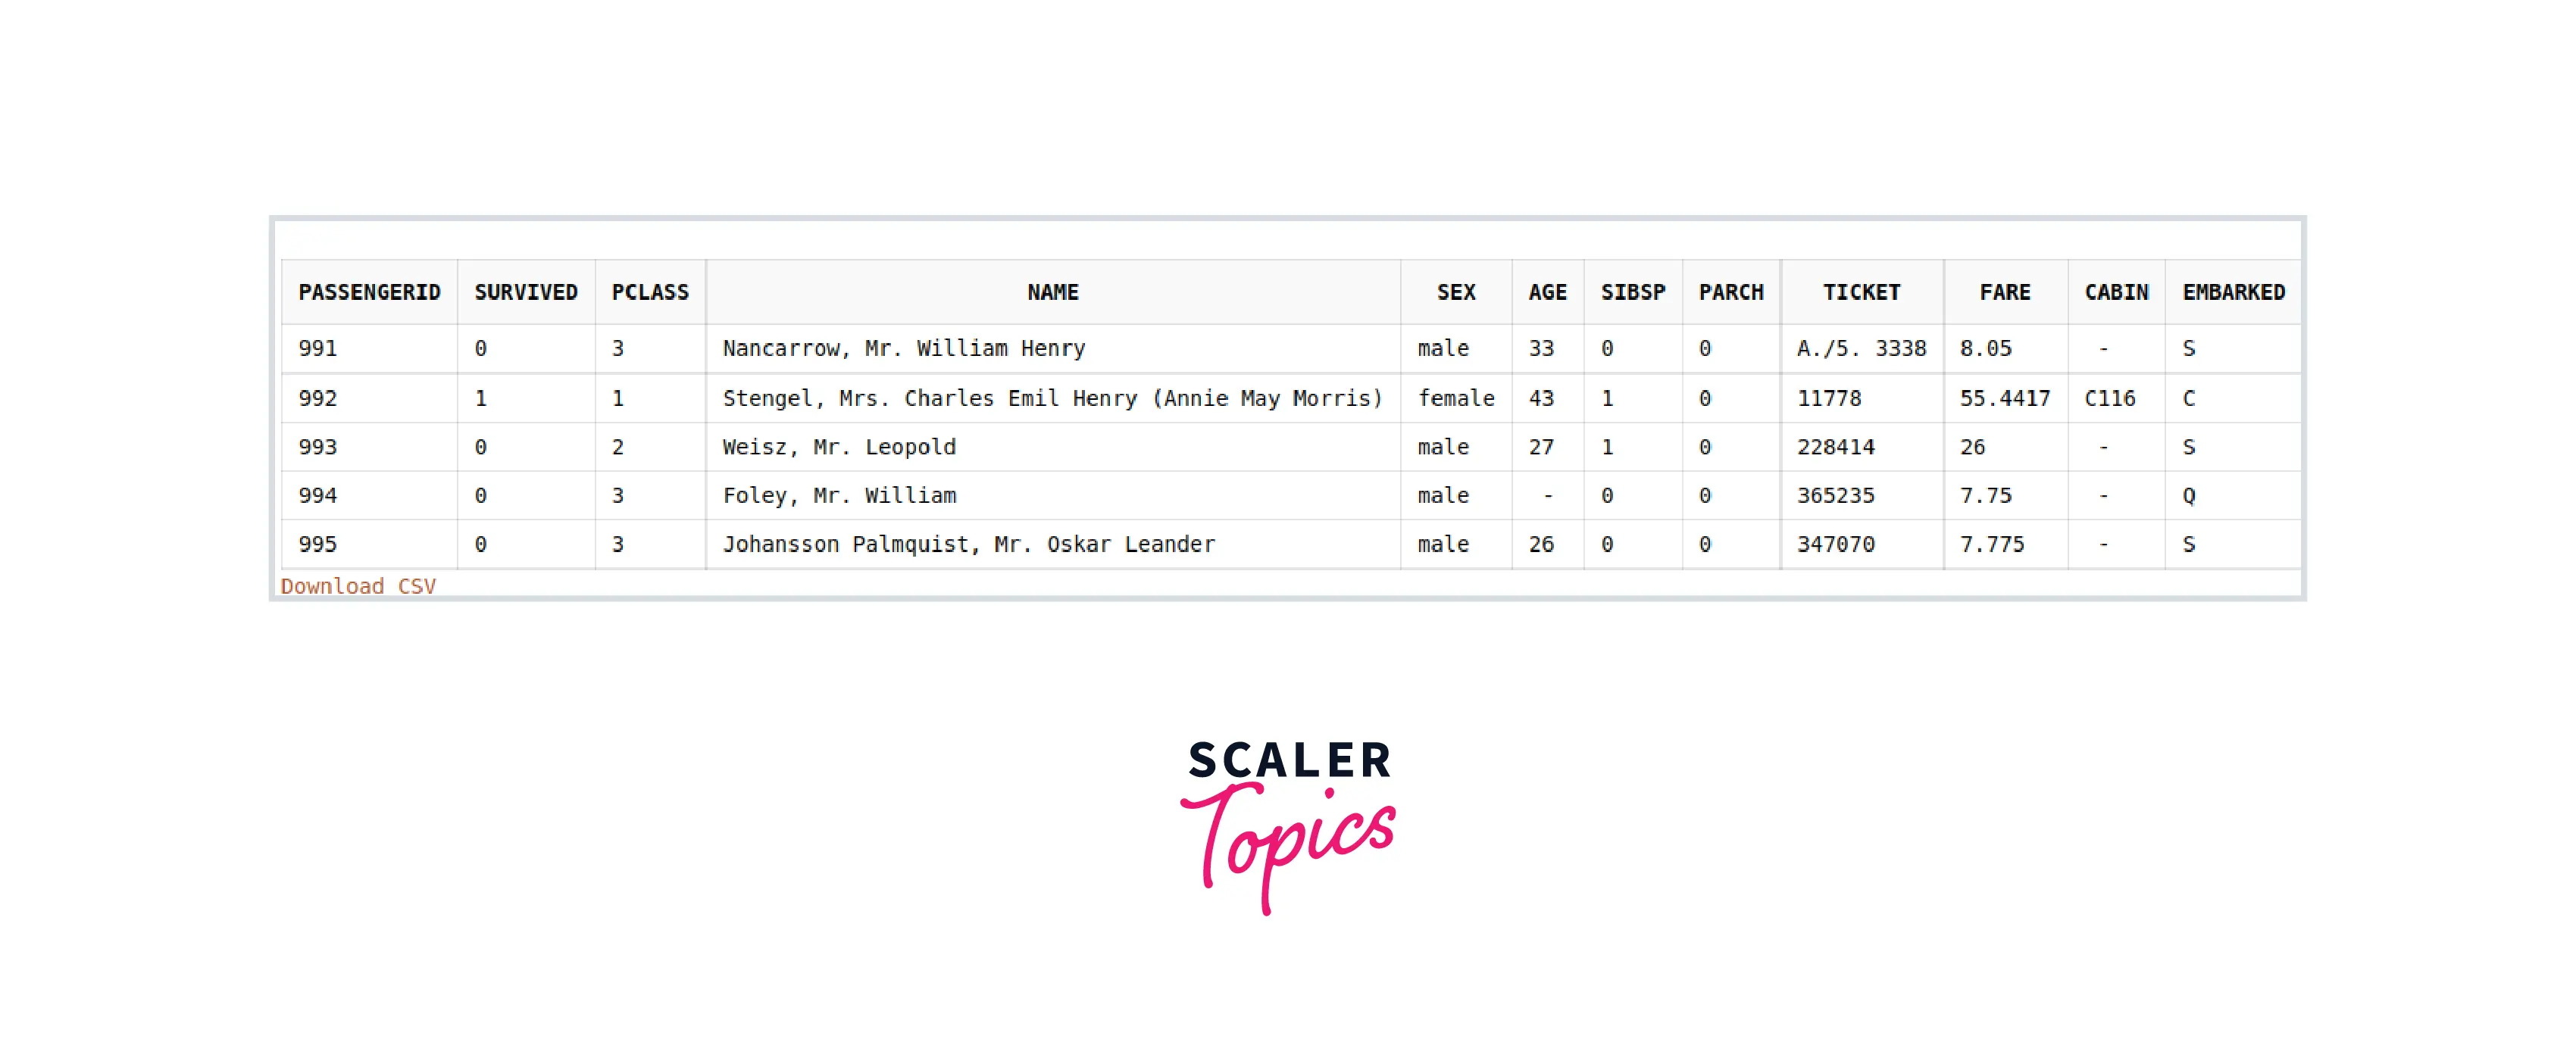
Displaying the first 5 rows of the dataset in Pandas requires the dataset.head(args) function. It, by default, displays the first 5 rows of the dataset. However, we can pass any number (say k) to display the first k records.
Output:
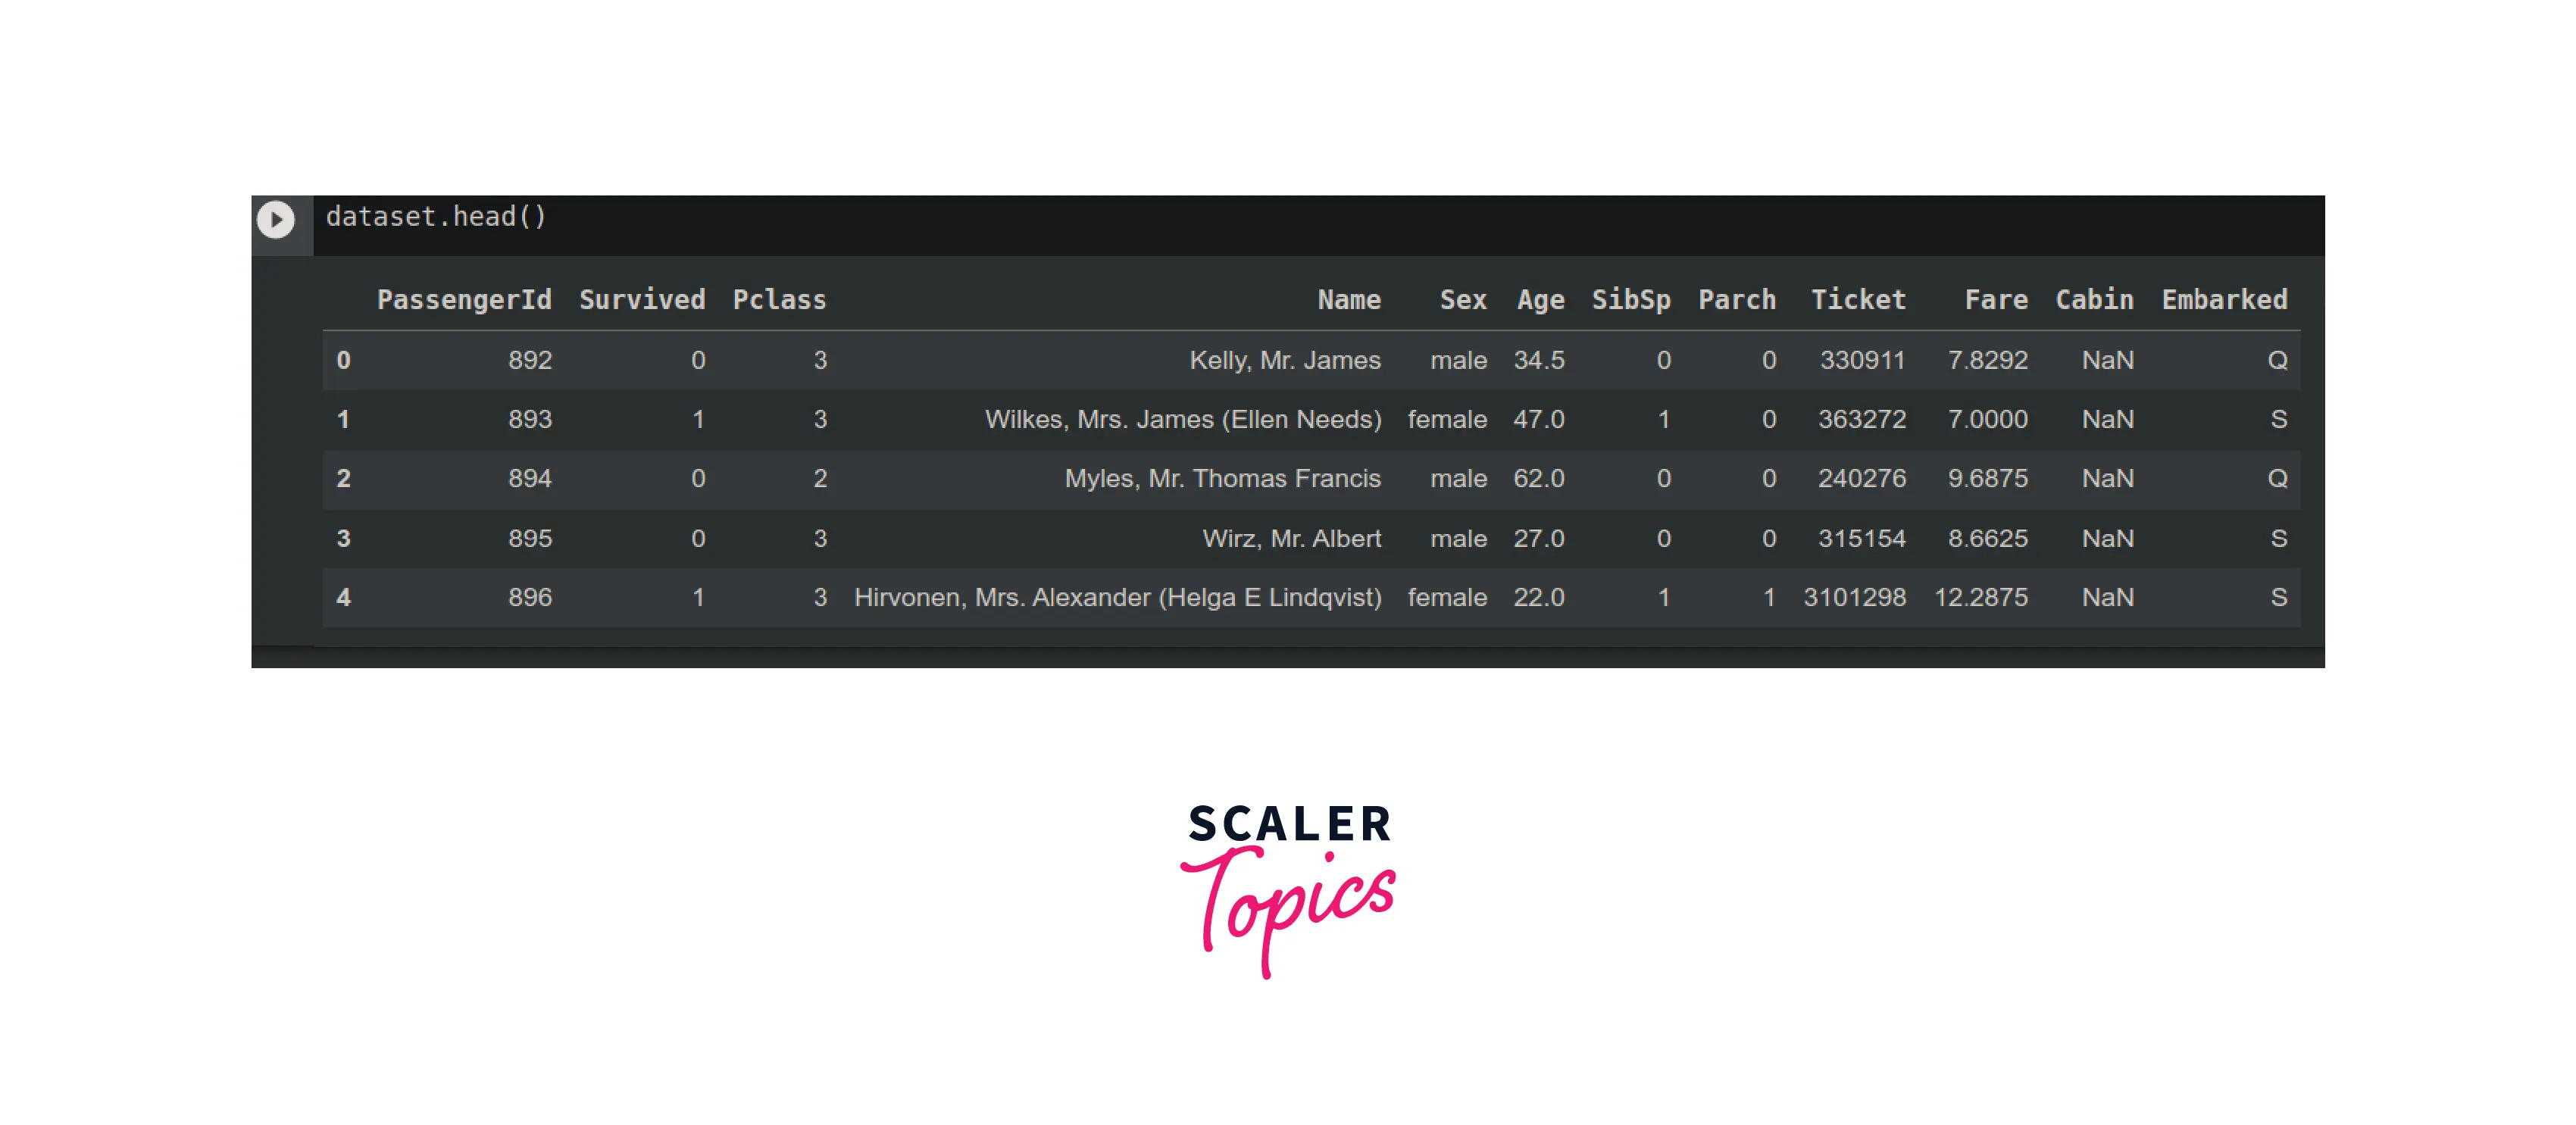
The first five rows of the dataset have been displayed on the console.
Selecting Particular Columns
In SQL, we just need to replace the asterisk(*) by the name of columns separated using commas.
Code:
Output:
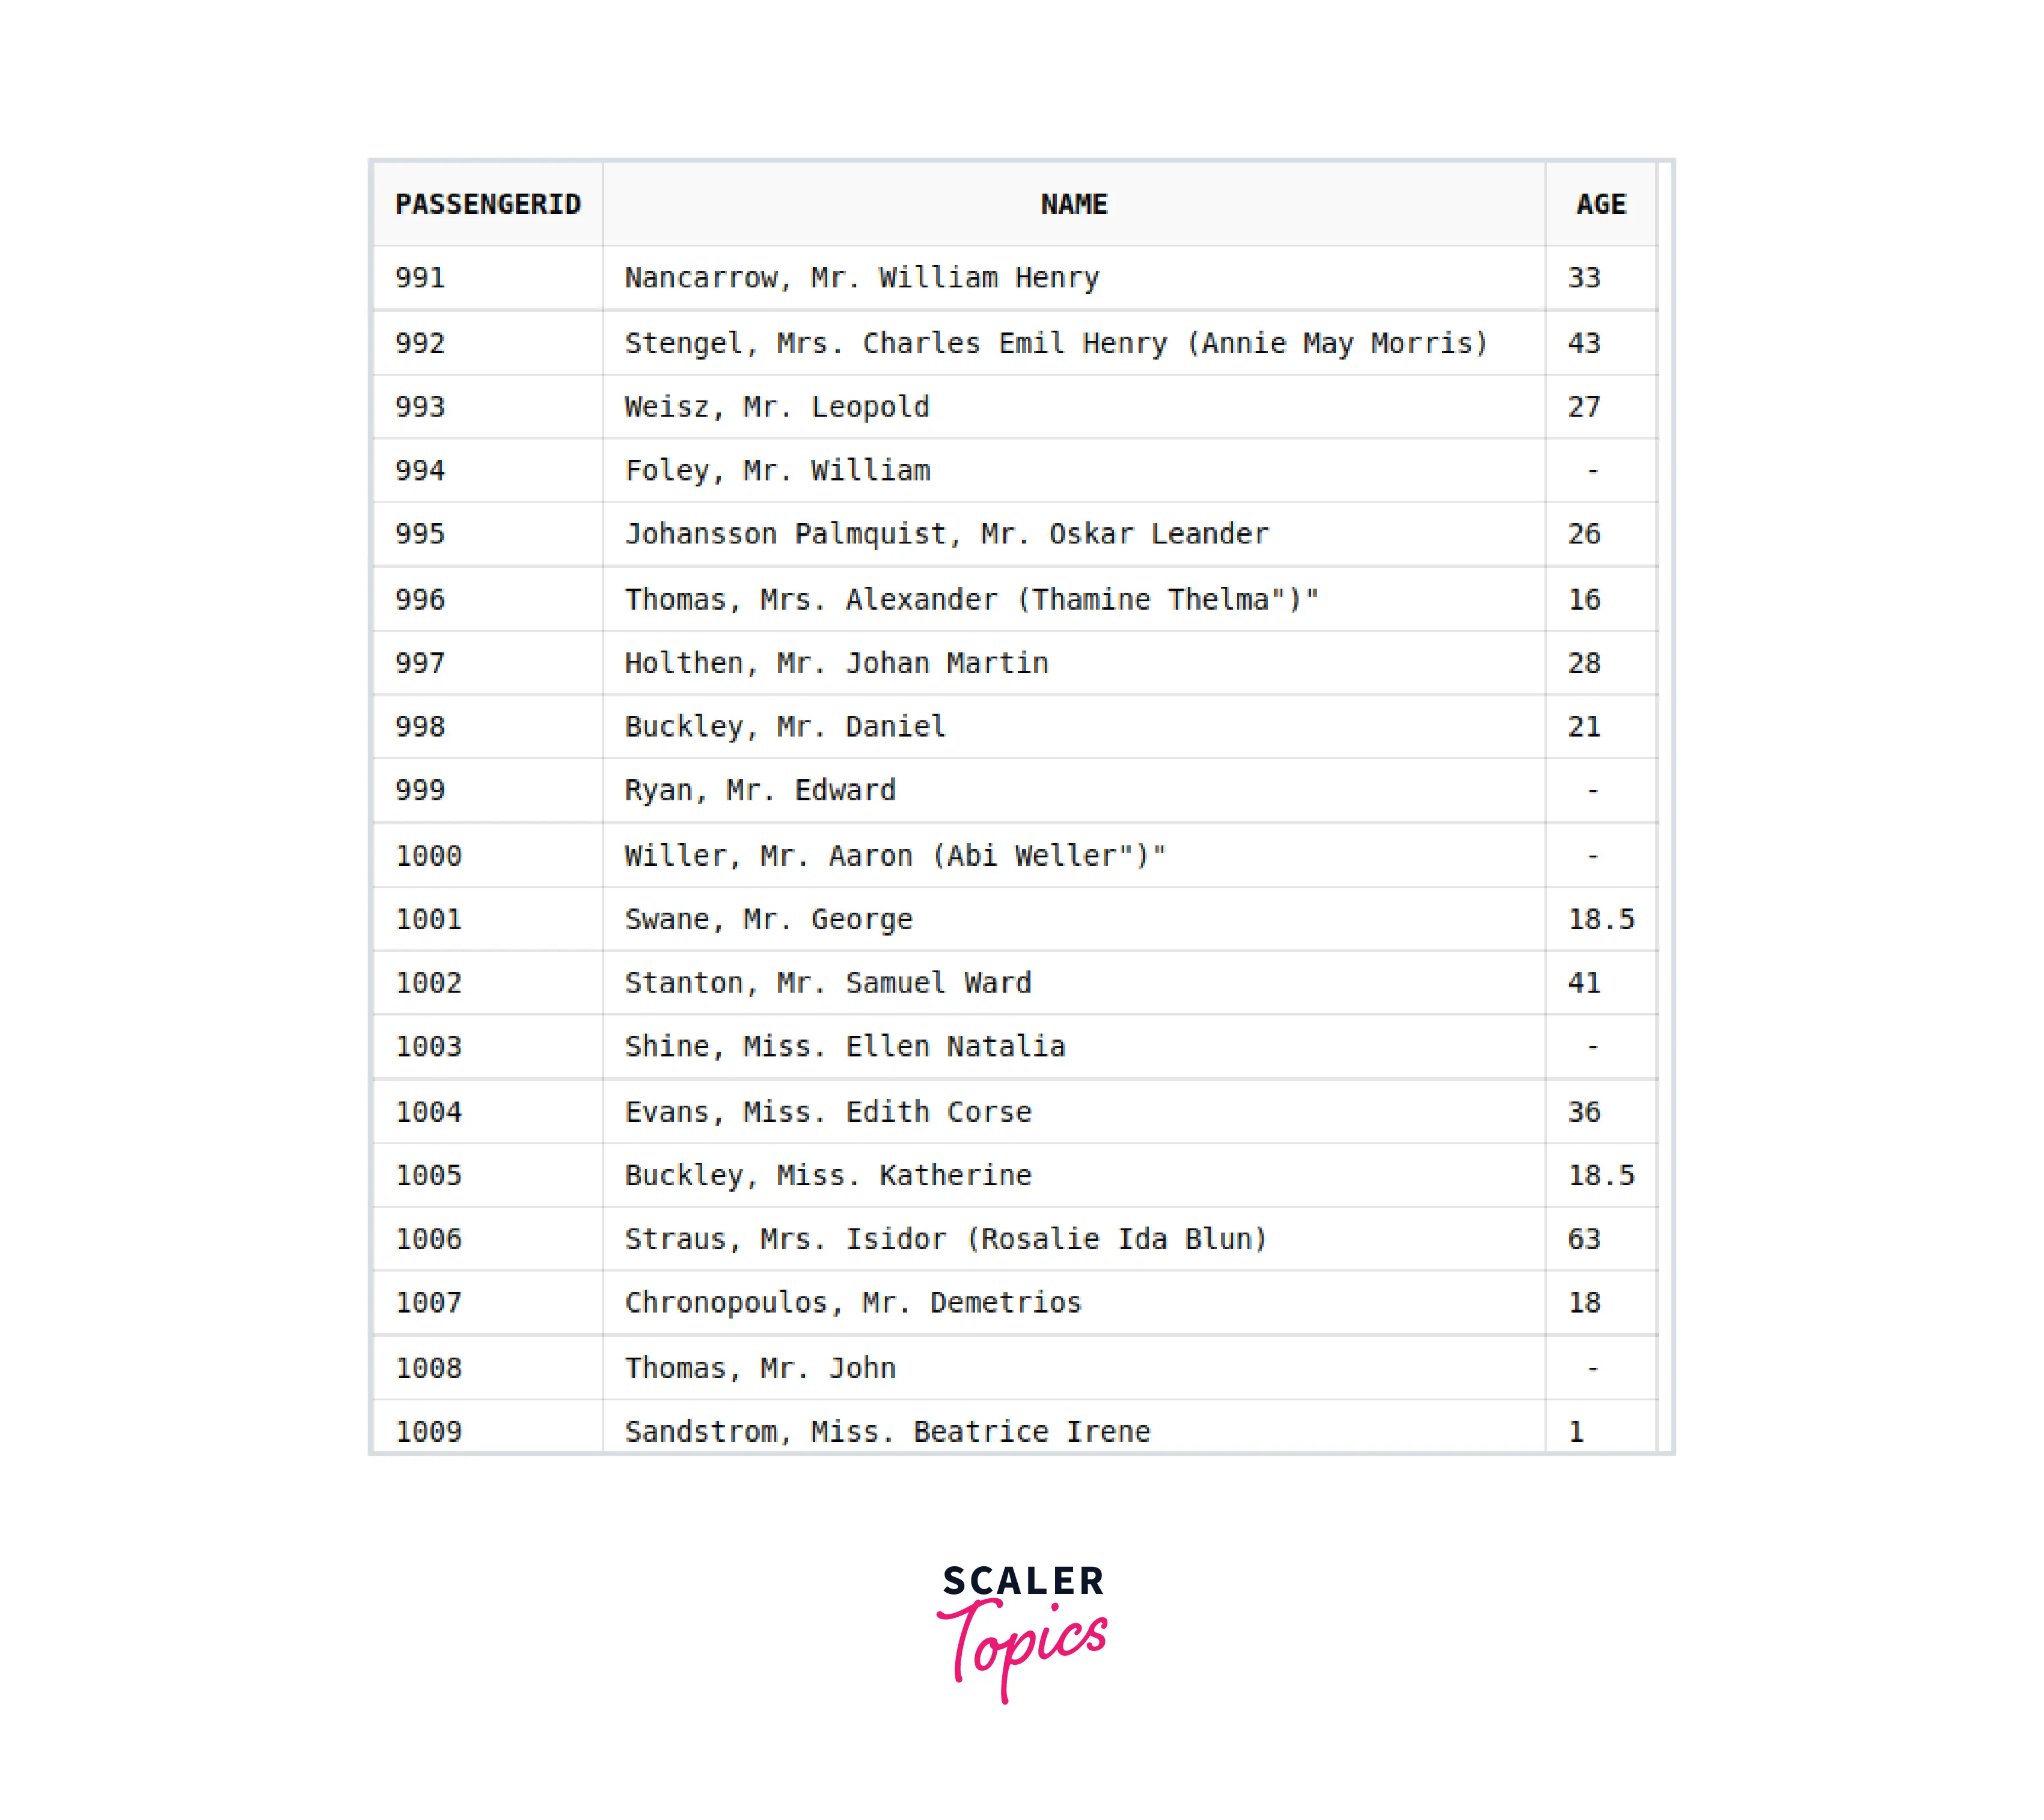
While to select some set of columns of data in Pandas, we just need to pass the name of columns as a List like - dataset[['column1', ..., columnK]]
Code:
Output:

Selecting Rows That Fit a Condition
This is one of the most extensively used queries in the real world. We usually need to see the record that fits some condition(s). For example, in our Titanic dataset, if we want to inquire about the passengers whose age is greater than or equal to 50.
In SQL, we have a very famous clause WHERE that we will be using to fetch the desired records.
Code:
Output:
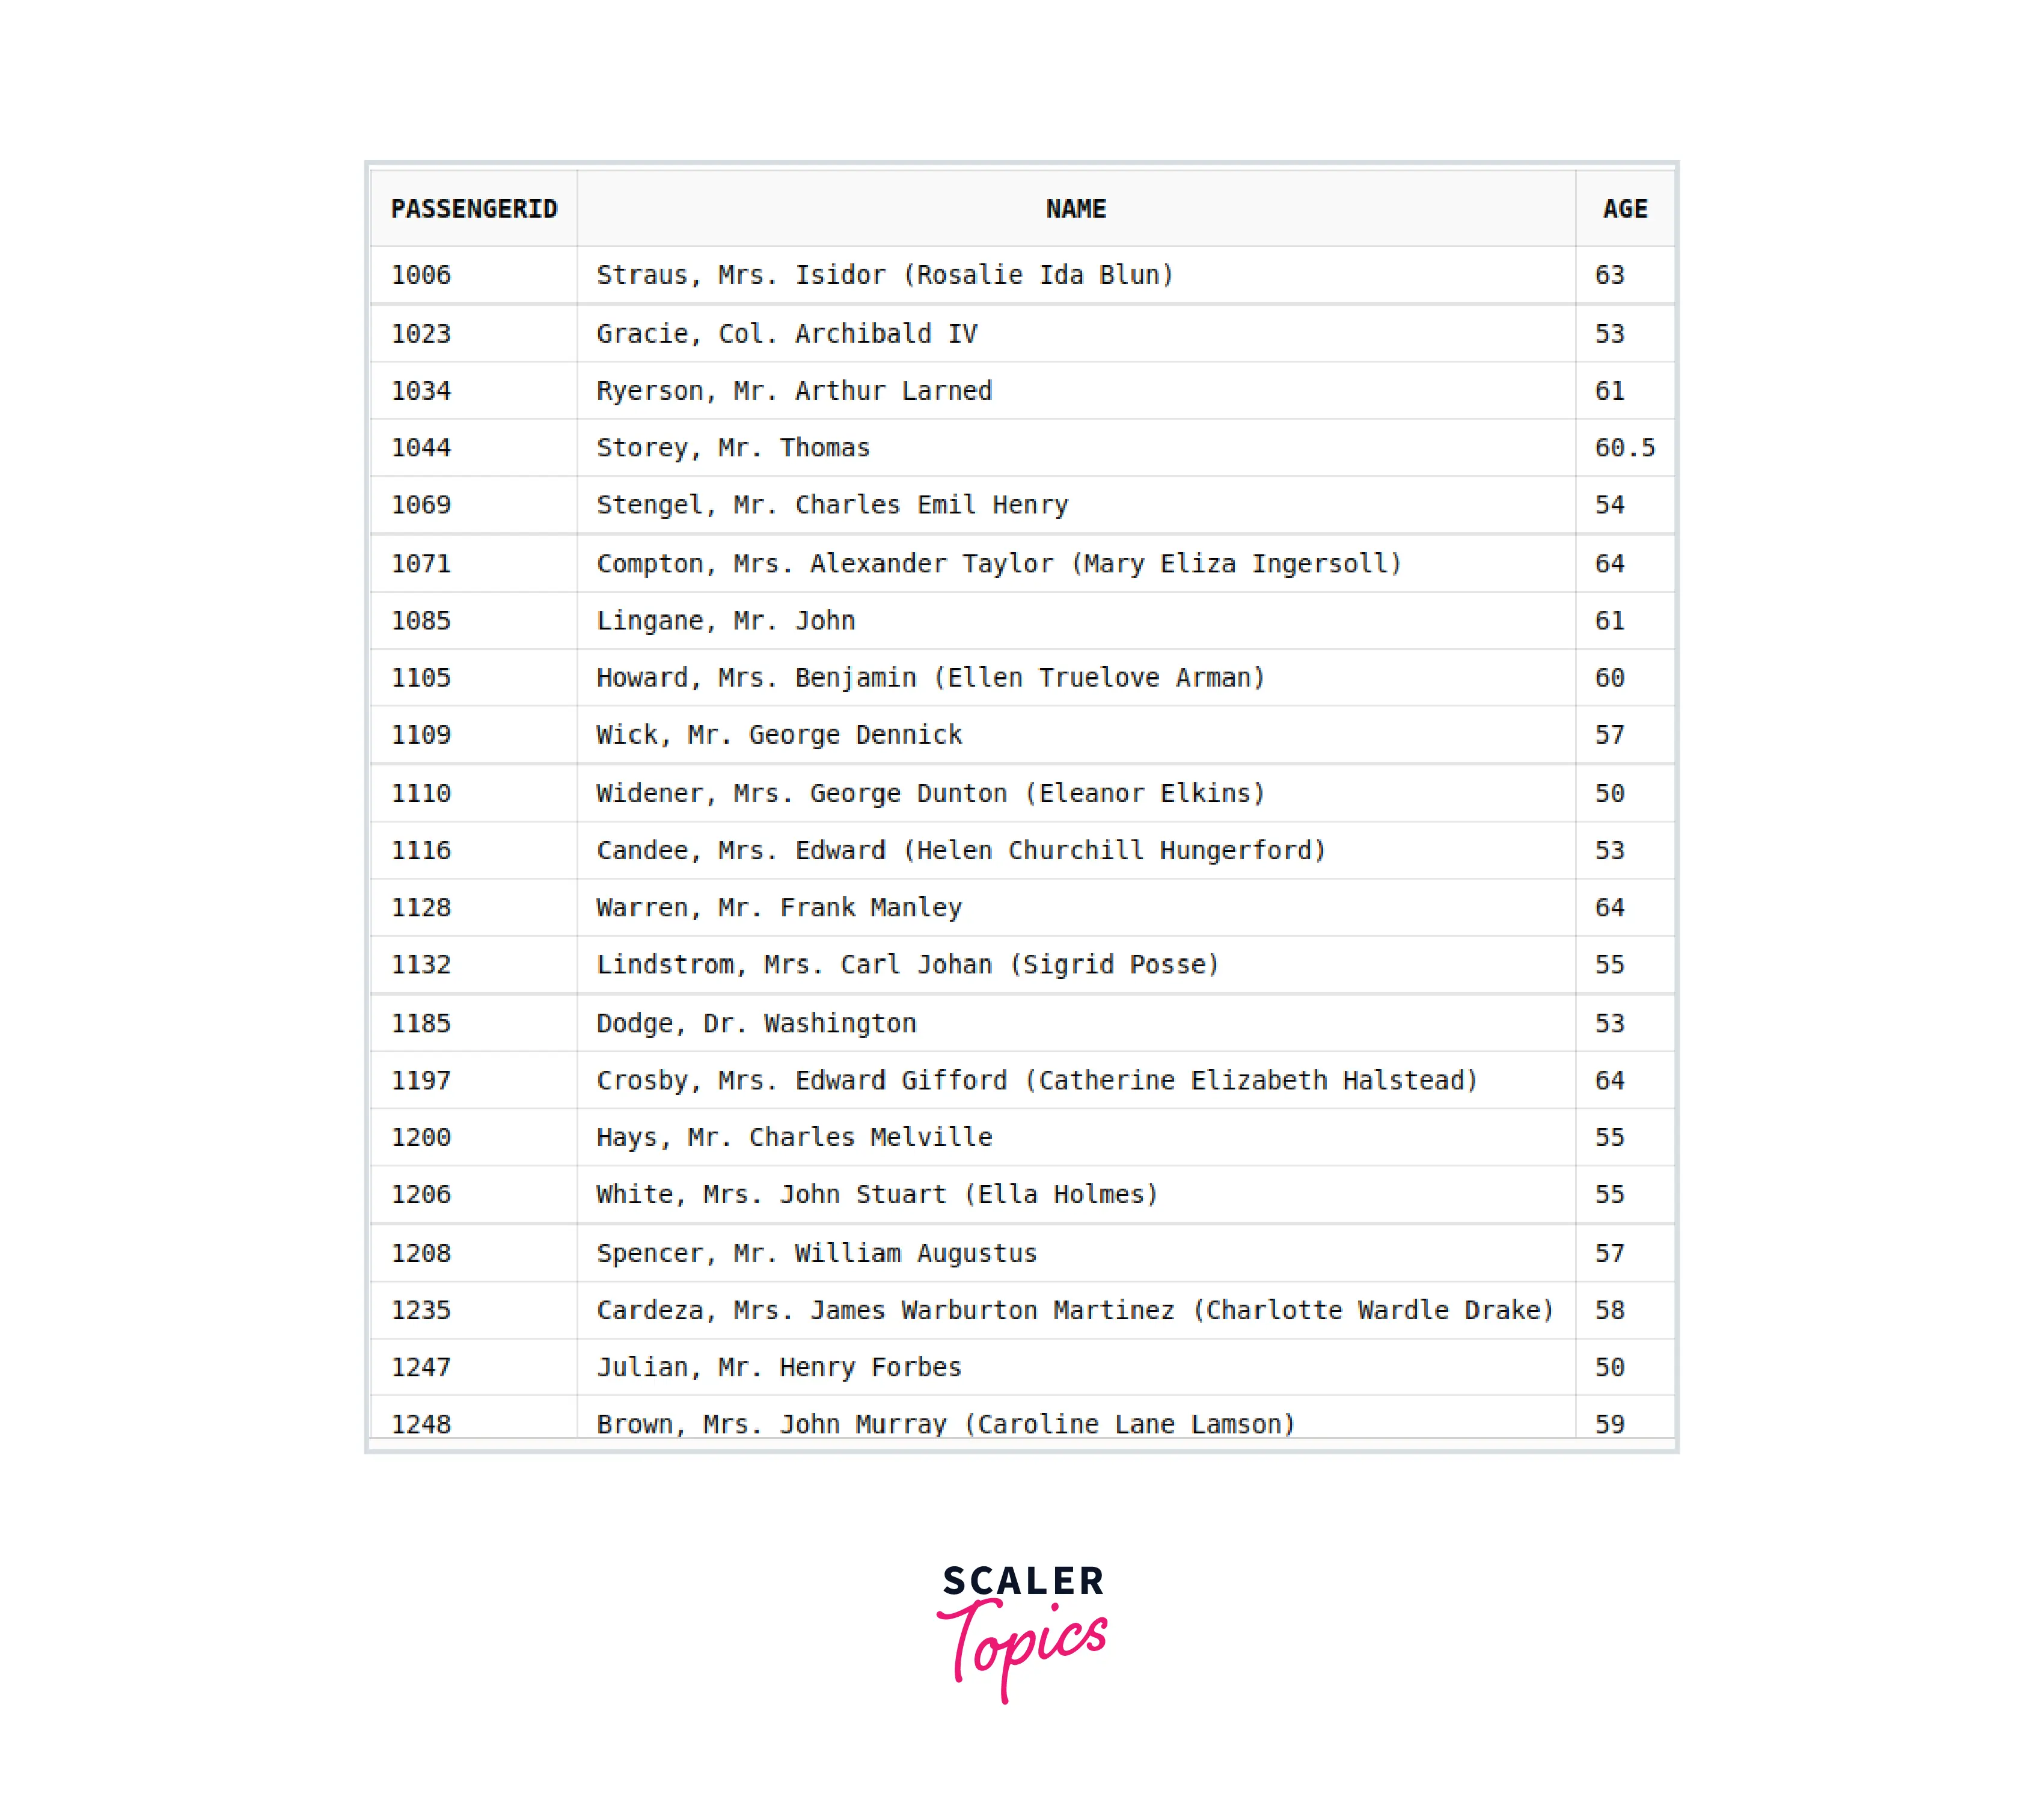
While in Pandas, we can include conditions like dataset[condition][columns to display].
Code:
Output:

Unique Values in Columns
Sometimes data analysts want to know the set of all possible values that may occur in a particular column. For example, if a column named 'city' is there in any 'student' database, then finding a distinct value in column 'city' tells us the about the cities to which students belong.
In SQL DISTINCT clause is used to perform this operation as shown below.
Code:
Output:
While in Pandas, we have the dataset.column.unique() statement, which will list down the unique values present in the 'column' of 'dataset'.
Code:
Output:
Number of Unique Values in Columns
In the previous section, we have seen how to find the distinct elements of a column, but here we will find the count of those elements. Though one may argue we can simply count the elements after using the DISTINCT or .unique() command. The reason is that it will be too time-consuming and impractical.
In SQL, we have the COUNT() clause that counts the number of records. So to count the number of unique records, we can use COUNT() along with the DISTINCT clause.
Code:
Output:
In the last section, we used the .unique() function to list the distinct values. Similarly, to count the distinct values, we use the .nunique() statement.
Code:
Output:
Number of Rows in Each Category
Often it requires clubbing the values of similar types into one. For example, counting the number of passengers who survived and the number of passengers who did not survive. In such cases, we use the GROUP BY clause along with the COUNT clause.
Code:
Output:
When using Pandas, we just need to use the .value_counts() command as shown below -
Code:
Output:
Groupby and Aggregate Functions
Groupby is used to group records based on some common attribute. It has already been discussed in the previous section. Please refer to it again for detailed insights.
We have the following Aggregate functions present -
- Sum
- Avg
- Min
- Max
Let's see how they differ in SQL and Pandas
1. Sum
To find the sum of values of a particular column we will use the SUM() clause of SQL.
Code:
Output:
Similarly, in Pandas, we have the .sum() function that prints the sum of all the values present in the column.
Code:
Output:
2. Avg
In SQL, AVG() is used to find the average of values present in a column.
Code:
Output:
In Pandas, we have the mean() function that prints the mean of values present in the column.
Code:
Output:
**3. Min **
In SQL, MIN() is used to find the minimum value present in a particular column.
Code:
Output:
In Pandas, we have the min() function to find the least value present in the column.
Code:
Output:
4. Max
In SQL, MAX() is used to find the maximum value contained in a particular column.
Code:
Output:
Similarly, In Pandas .max() function is used to find the largest value of the column.
Code:
Output:
Update
To update the values in SQL, we simply use UPDATE and SET clauses, to modify the value of cells specified in the query.
Code: To double the fare of each individual
Output:
Similarly in Pandas, we use the .loc command to change the values as per the operation written after.
Code:
Note - loc is used to access/modify a group of rows and columns based on the parameters passed.
DELETE
In SQL, we use DELETE when we need to delete some particular rows from the table based on certain condition(s).
Code:
Output:
While in Pandas, we just do not delete the rows instead we keep the rows that we need and discard others.
Code:
Limit
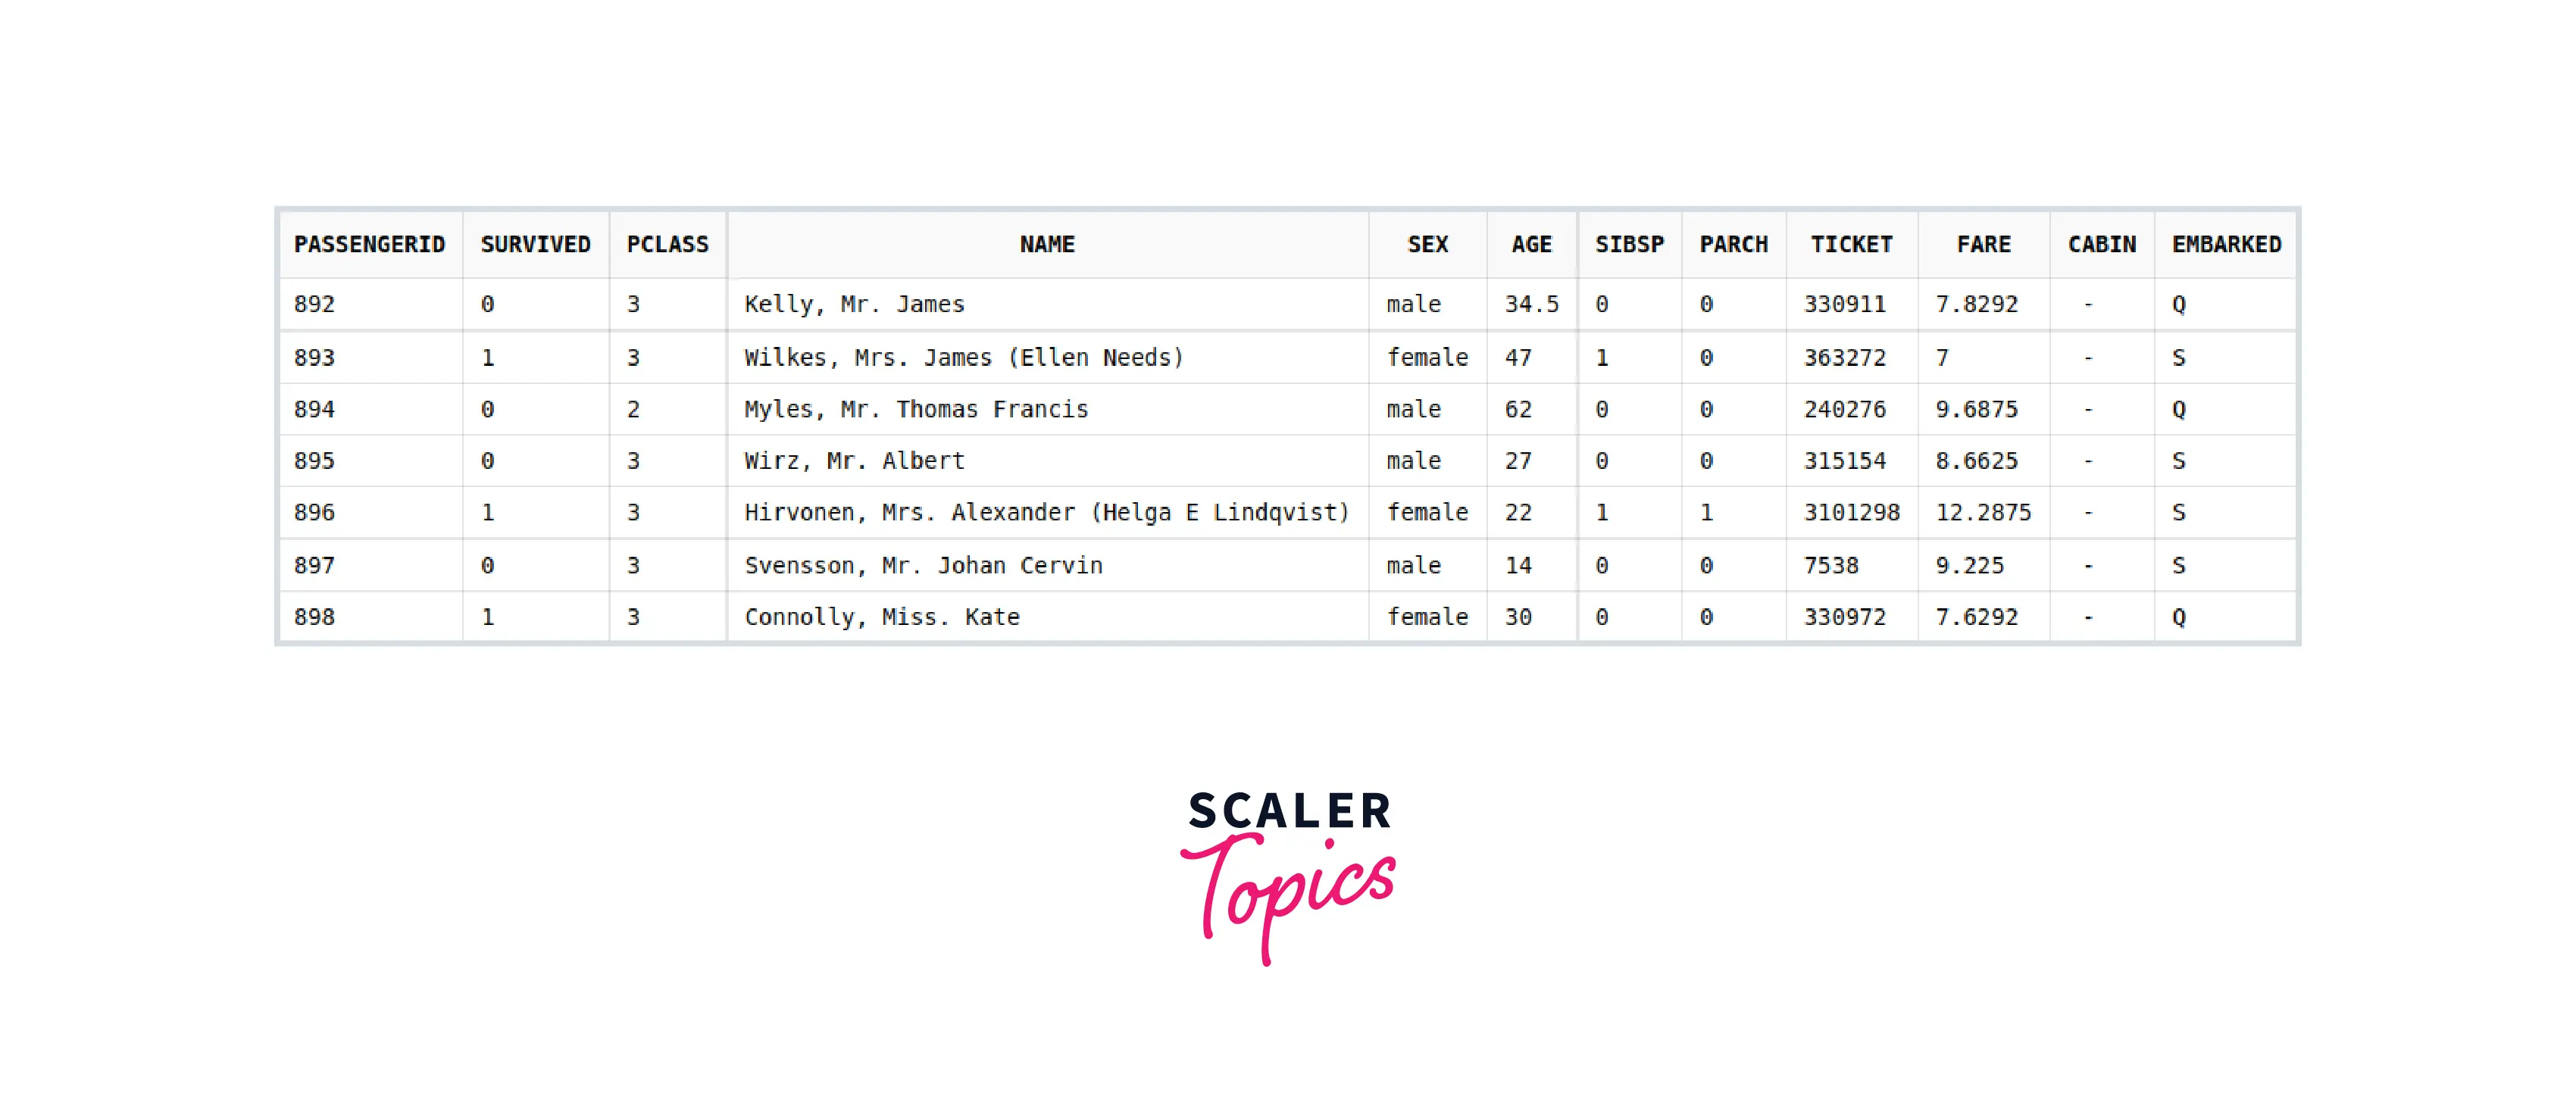
In SQL, LIMIT is used to limit the number of rows displayed as result. For example, if we want to see only the top 7 records we can use Limit with 7.
Code:
Output:
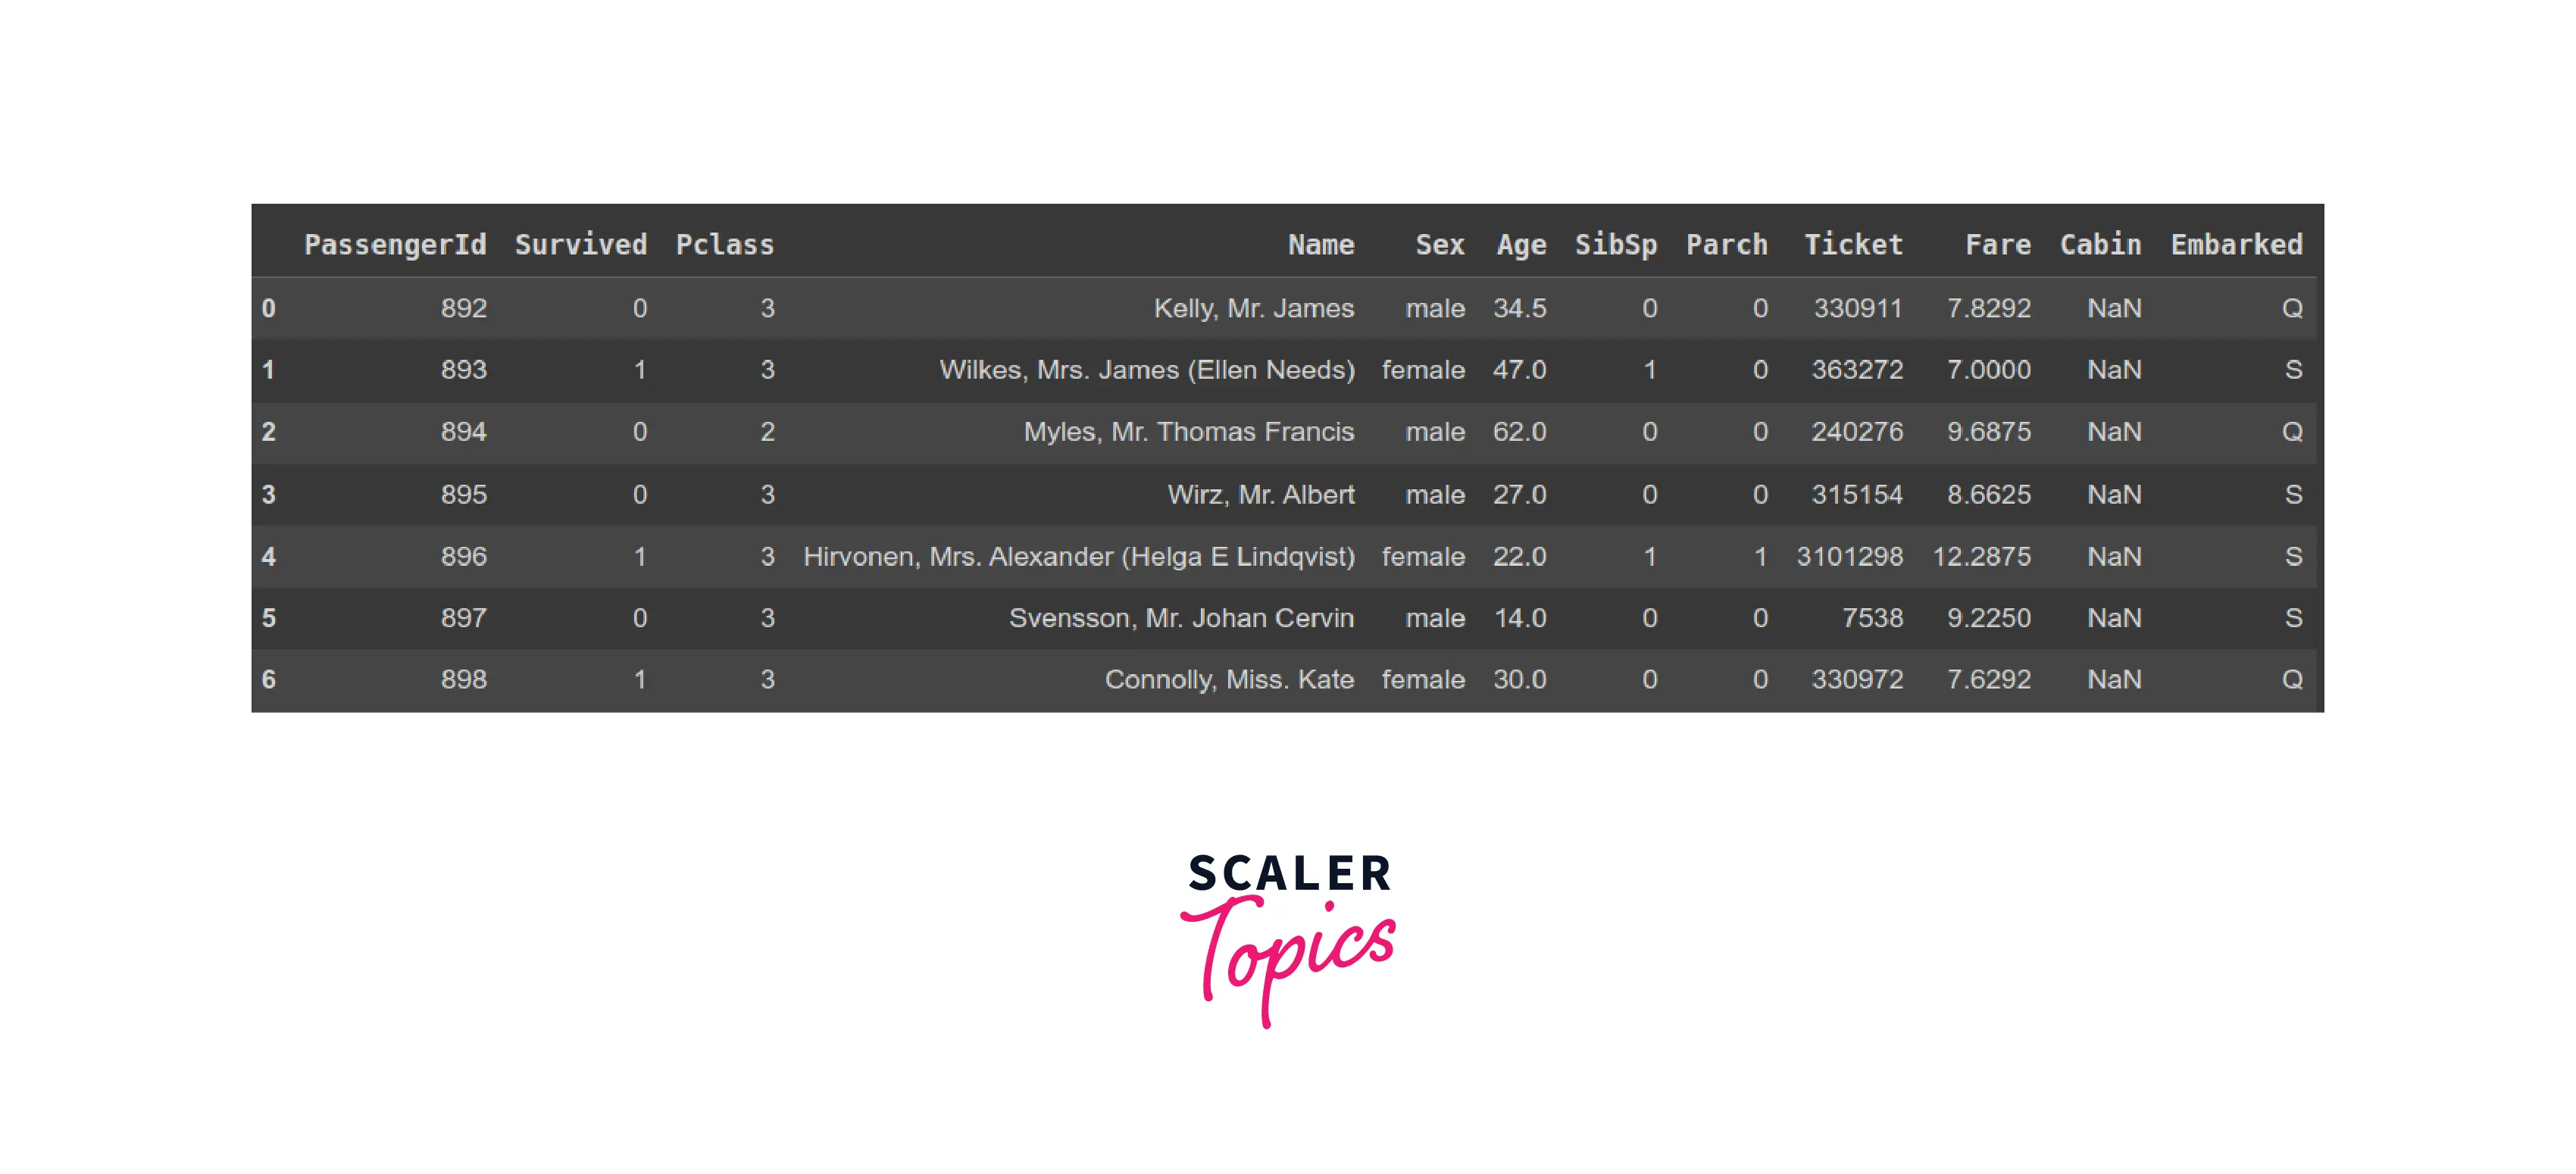
While in Pandas we can use the .head(k) command to display the first k records of the dataset.
Code:
Output:
Union
Union operation can not be clearly understood using the Titanic dataset, hence here we will define another dataset as follows -
Table1 -
| City | Population |
|---|---|
| Kanpur | 100000 |
| Delhi | 500000 |
| Hyderabad | 250000 |
| Banglore | 400000 |
Table2 -
| City | Population |
|---|---|
| Chennai | 400000 |
| Delhi | 500000 |
| Hyderabad | 250000 |
| Mumbai | 600000 |
The UNION operation in SQL works on two tables and merges the records of both of them and removes the duplicate records.
Code:
Output:
While in Pandas, we use the concat() function to merge two data frames and .drop_duplicates() to remove the duplicate tuples from the merged dataframe.
Code:
Output:
Joins
1. Full Join
In SQL, we use FULL JOIN to perform the Full Join operation on two tables.
Code:
Output:
In Pandas, we will pass how = Outer in the merge() function to perform the Full Join operation.
Code:
Output:
2. Right Join
We have RIGHT JOIN in SQL to perform the Left Join operation.
Code:
Output:
In Pandas, we need to pass one additional argument to the merge() function how = right to perform the Right Join operation.
Code:
Output:
3. Inner Join
We use INNER JOIN in SQL to perform the Inner Join operation.
Code:
Output:
While in Pandas we will use the merge() function to do Inner Join.
Code:
Output:
4. Left Outer Join
We have LEFT JOIN in SQL to perform the Left Join operation.
Code:
Output:
In Pandas, we need to pass one additional argument to the merge() function how = left to perform the Left Join operation.
Code:
Output:
Conclusion
- Both SQL and Pandas are important tools for Data Analysis.
- The logic behind most of the functions is similar in both of them, with just a few minor syntactical changes.
- If you want just to access/modify the data using some filter, then SQL will be an efficient option.
- Pandas can perform complex grouping operations easily.
